
The yield curve is a graphical representation of interest rates for bonds of varying maturities at a specific point in time. Commonly associated with U.S. Treasury securities, the yield curve plots short-term, intermediate, and long-term interest rates. Its shape provides critical insights into market expectations for economic growth, inflation, and the potential for a recession. Over the past four decades, shifts in the yield curve have served as a leading indicator of economic activity, prompting economists to analyze its patterns closely.
The Anatomy of the Yield Curve
There are three main types of yield curve shapes:
- Normal Yield Curve: In a healthy, growing economy, the curve slopes upward, reflecting higher yields for long-term bonds compared to short-term bonds. Investors demand a risk premium for holding long-term securities.
- Inverted Yield Curve: When short-term yields exceed long-term yields, the curve slopes downward. Historically, this has been a reliable predictor (although not guaranteed) of economic recession.
- Flat Yield Curve: A flat or nearly flat yield curve indicates uncertainty, often signaling a transition period in the economy.
What the Yield Curve Reveals About Economic Indicators
Economic Growth
A steep yield curve, where the spread between long-term and short-term rates widens, often signals robust economic growth. Conversely, a flattening yield curve, where the difference narrows, can suggest slower growth ahead.
Expected Inflation
The yield curve also reflects investor expectations for inflation. A steepening curve may indicate rising inflation expectations, such as when the economy heats up, while a flattening or inverted curve can signal the potential for disinflation, or possibly deflation or a recession.
Recession Potential
Perhaps the most significant implication of the yield curve is its predictive power for recessions. An inverted yield curve has preceded every U.S. recession since the 1950s, making it one of the most reliable indicators in macroeconomic forecasting.
Exhibit 1 below indicates five recent time periods where the yield curve inverted:
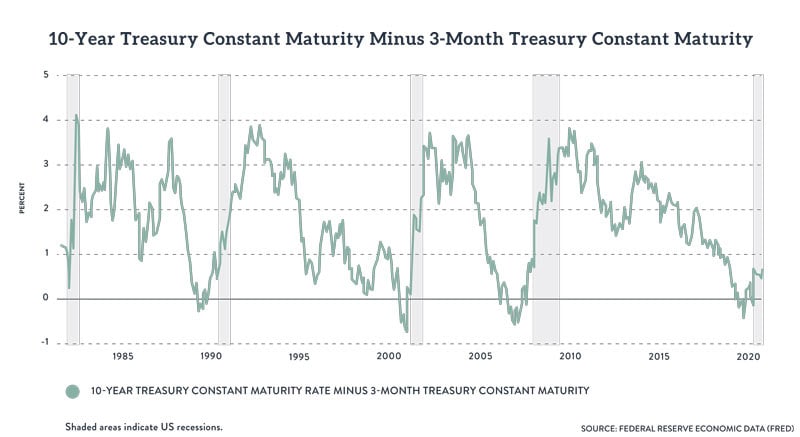
Exhibit 1 (Source: FRED, St. Louis Fed database)
Historical Examples of Yield Curve Analysis
1. 1980s Double-Dip Recession
In the early 1980s, the yield curve inverted as the Federal Reserve, under Paul Volcker, aggressively raised short-term interest rates to combat double-digit inflation. Economists widely predicted a recession, and they were correct. The U.S. experienced back-to-back recessions in 1980 and 1981-82. The inverted yield curve proved to be an accurate predictor of economic contraction during this period.
2. 1990-91 Recession
By the late 1980s, the yield curve began to flatten as the Federal Reserve tightened monetary policy to cool an overheating economy. Economists noted the flattening trend and forecasted slower growth. The predictions came true when the U.S. entered a recession in 1990, exacerbated by the Gulf War and rising oil prices. Once again, the yield curve’s behavior accurately signaled trouble ahead.
3. 2000 Dot-Com Bubble
As the 1990s tech boom reached its peak, the yield curve inverted in late 2000. Economists and market analysts interpreted this inversion as a warning sign. Their predictions were validated when the dot-com bubble burst, leading to a recession in 2001. The curve’s inversion highlighted the economy’s vulnerability to speculative excesses and the Federal Reserve’s tightening cycle.
4. 2007-2008 Global Financial Crisis
In 2006, the yield curve inverted, causing alarm among economists who correctly anticipated a looming recession. The housing market’s collapse and subsequent financial crisis validated these predictions. The yield curve’s inversion was a critical early warning of one of the most severe economic downturns in modern history.
5. 2020 COVID-19 Recession
In 2019, the yield curve inverted briefly, raising concerns among economists about a potential recession. While the inversion did not predict the pandemic, it did signal underlying vulnerabilities in the global economy. When COVID-19 struck in 2020, the recession confirmed earlier fears about economic fragility. Although the cause of the recession was unprecedented, the yield curve’s inversion once again underscored its predictive power.
The Yield Curve and Inflation Predictions
The yield curve also informs inflation expectations. For instance:
- A steepening curve in the early 2000s reflected concerns about rising inflation due to rapid economic expansion.
- In the aftermath of the 2008 financial crisis, a flattening curve signaled disinflation as the Federal Reserve implemented quantitative easing.
- More recently, a steep curve in 2021 pointed to heightened inflation expectations as pandemic-era stimulus fueled consumer demand.
Limitations and Caveats
While the yield curve is a powerful tool, it is not infallible. Factors such as unconventional monetary policies (e.g., quantitative easing) and global demand for U.S. Treasuries can distort the curve’s traditional signals. For example, during the 2010s, persistent low interest rates led to a flatter curve despite steady economic growth, complicating predictions.
Conclusion
The yield curve serves as a vital barometer for economic growth, inflation, and recession risks. Its shape encapsulates collective market expectations, making it an indispensable tool for economists, policymakers, and investors alike. By examining historical patterns and their accuracy, we can appreciate the yield curve’s role as a window into the economy’s future, even as we acknowledge its occasional limitations.
Understanding the yield curve is more than an academic exercise; it’s a practical necessity for anyone navigating the complexities of modern financial markets.