
Oftentimes investors spend substantial time and energy evaluating the returns of their portfolio, comparing those results to some popular market benchmark like the S&P 500. However, there are serious considerations that must be understood to avoid common mistakes that often lead to a negative impact on dollars. While returns matter, at the end of the day it’s growing your dollars that counts.
When it comes to investing mistakes, one of the biggest is not understanding how our risk (measured by volatility) impacts results. Bigger drawdowns take longer to recover, and that extra recovery time is lost compounding. Down markets and long recovery times interrupt compounding. Making matters worse, the deeper the drawdown the bigger the returns have to be just to get back to breakeven. You can see this is the table below.
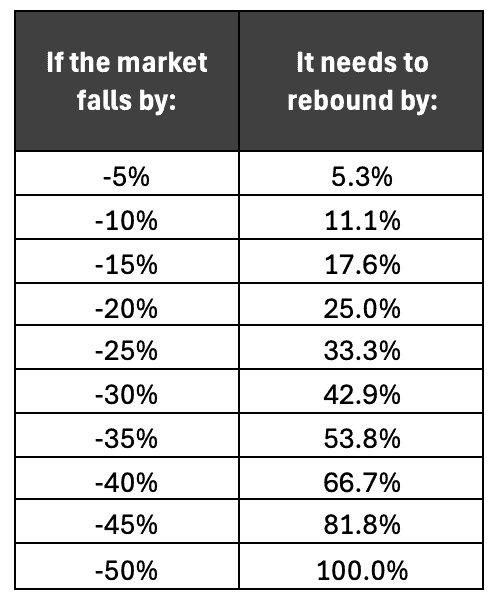
Most investors understand the table above. If you lose half, you have to double up to get back to even. The classic “double-or-nothing”. What they don’t always realize is how drawdowns and volatility impact the dollar results one needs to achieve their goals.
The table below illustrates this fact. The mean return of the S&P 500 for the 20 years from 2005 – 2024 was 9.7% with volatility risk of 17%. If you invested $1 million over this time frame you’d have just shy of $5 million by year-end 2024. The interesting part is the other alternative returns, like consistent returns, means that results are less, or not interrupted. A consistent return means the same 9.7% average but higher volatility of 25% only ended with $3.5 million. That’s major underperformance! But it works in reverse too. The zero volatility return stream had an ending value of more than $6.3 million.
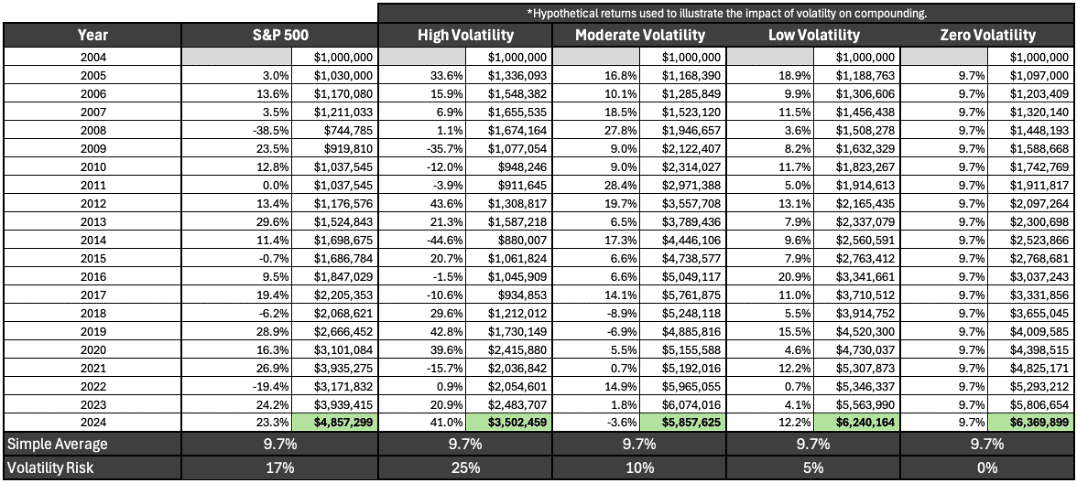
As you can see, even though each consistent return has the same average, the impact of volatility is substantial. Let’s turn this on its head. The table below explores the same concept, but instead of keeping the average return the same, it shows what average return would be necessary to get the same ending dollars after accounting for the risk.
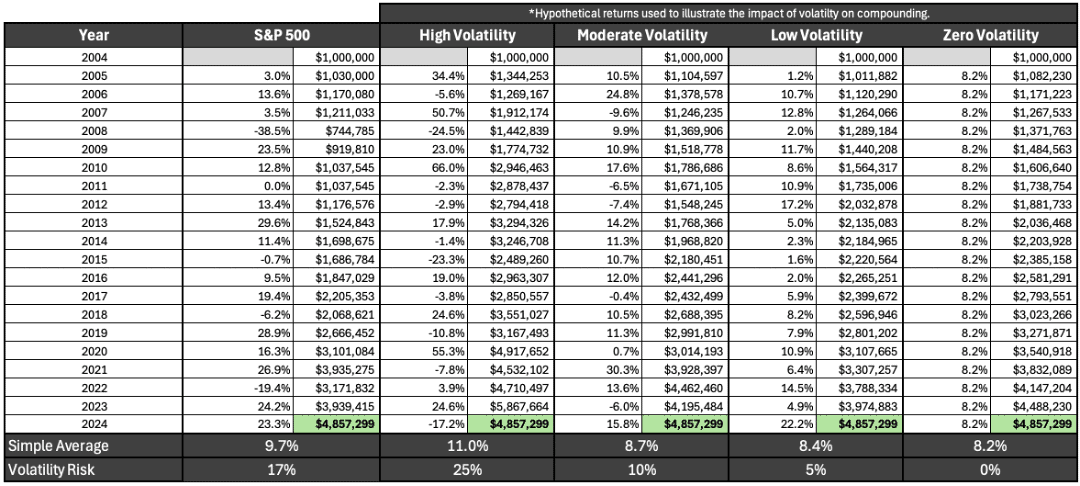
As you can see, each portfolio starts with $1 million and ends with $4,857,299, but as the portfolio’s riskiness increases, the average return required to achieve that result increase as well. The S&P 500 needed a 9.7% average with Volatility Risk of 17%, but the zero-volatility portfolio only needed 8.2% to achieve the same results.
This is the impact risk has on compounding and why looking at 1 or 2 years of returns can lead investors into a trap. High risk sectors like growth and tech stocks might post eye-watering returns like those in the “High Volatility” portfolio above, but the drawdowns can be violent, leading to higher required returns to get the same long-term outcome as a low-risk, balanced portfolio.
This is why Linden Thomas & Company never stops advising our clients to buy quality companies, spread risk, and maximize cash flow and yield on the bonds. It’s not always thrilling, but sometimes a nice Sunday drive beats a roller coaster ride that leaves you feeling sick from all the twists and turns.
Breaking Tradition
Our team at Linden Thomas & Co. broke tradition to build a more efficient index that moves away from the shortfalls of market cap indexes, with a focus on enhancing long-term compounding. This undertaking meant that we needed to address all three dynamics of compounding First-maximizing upside capture. Second – minimizing downside capture and third – shortening the down market recoveries. While we believe no investor can consistently time market rallies and drawdowns, what we have found over the 35 plus years of managing high net worth investors is that quality of the portfolio matters. Direct ownership matters – and minimizing costs matter.
While some investors may try to enhance compounding through adjusting their portfolio allocation, this only solves a very small part of what’s needed – much like getting an oil change when you need a whole new engine. Enhancing long-term compounding means opening the hood and removing or fixing parts that impact all three factors – so that upside is maximized, downside is minimized, and down-market recovery is shortened.
This is what set us on our journey to build an enhanced index. The goal: move away from selling average returns and instead focus on building efficient portfolios with a focus on efficiency–tailoring each portfolio with our clients’ portfolio values in mind.
Building a More Efficient Index
Because earnings quality of holdings, direct ownership, and cost really do matter to investor compounding, Linden Thomas & Co. and its team set out to build an institutional index focused on company earnings quality, giving investors direct ownership, and minimizing the hidden costs of retail investment products.
Because results have a direct correlation to portfolio efficiency, we set out to build indexes that consider all compounding factors–upside, downside, and down-market recovery. This empowers investors who seek strong long-term results with less downside and quicker recovery.
Related Articles
What are Rallies, Pullbacks, and Average Returns?
Investment Principles,
Top Investment Principles FAQs,
Understanding Results,
November 3, 2023

How Do Recent Returns Impact Average Returns?
Investment Principles,
Top Investment Principles FAQs,
Understanding Results,
November 19, 2024
What Happens When Average Returns Flip?
Markets,
February 11, 2025