

In the midst of a strong stock market rally, it’s not uncommon for investors to have a mix of enthusiasm and even more concern. “Why haven’t I done as well as the market?”, investors may ask. And it’s a fair question–especially when headlines boast of record highs and double-digit returns. The answer, in a word, is diversification – or the spreading of risk. And at the heart of that diversification lies an underappreciated asset class: bonds.
While it’s tempting to view fixed-income as a drag on returns when stocks are hot, the reality is that bonds play a critical, stabilizing role, especially for investors in the withdrawal phase of their financial lives. This article explores two often-overlooked benefits of holding bonds in a portfolio: their impact on volatility and their ability to help prevent negative compounding.
Understanding Negative Compounding
At our firm, we define negative compounding as the down-market impact on dollars which is often amplified by distributions. It’s the classic retiree’s dilemma–taking income from a portfolio that’s temporarily under water. When this happens, not only is capital being depleted during a downturn, but the remaining portfolio is smaller and therefore less able to participate in the recovery.
The Math Behind It: A Real-World Example
Let’s examine a historical case: the 10-year period ending in 2011–a timeframe that includes both the Dot-Com bust and the Global Financial Crisis. The S&P 500 delivered an annualized return of approximately -2.8% over this period, which included substantial volatility. For a retiree drawing 4% per year, those early downturns would have a lasting impact.
Using a starting portfolio of $1 million and a fixed 4% annual withdrawal rate:
- 100% Stock Portfolio:
Experiences deep drawdowns during 2001-2002 and again in 2008. Withdrawals made during these down years permanently impair capital, making it difficult for the portfolio to fully recover. By 2008, the portfolio could easily have fallen below $500k, depending on withdrawal timing. - 60/40 Portfolio with 5% Bond Coupon:
With 40% of the portfolio in bonds, generating $20,000 annually, the investor only needs to sell about $15,000 of stock per year to meet their income needs. This approach preserves more shares during downturns and allows for greater participation during recoveries. The portfolio remains more resilient and experiences significantly less volatility.
The tables below show the differences between the results of a 100% stock portfolio and one that is a 60/40 blend (ie: 60% stocks and 40% bonds). The blend also includes a hypothetical 4% annual coupon payment along with a conservative 2.5% annual growth rate for the bond position:
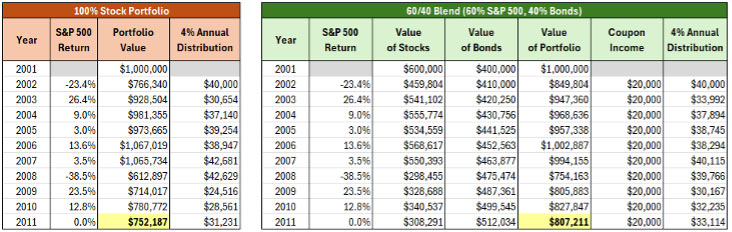
Exhibit 1 (Source: Factset; assumes a 5% fixed coupon and bond appreciation is 2.5% annually; These are hypothetical returns and time periods shown are included strictly for illustrative purposes. These returns are not reflective of any investment strategy by the investment adviser nor are they the results of any client account managed by the adviser.)
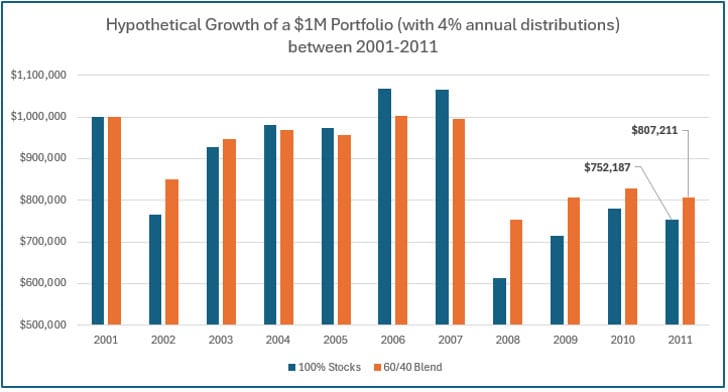
Exhibit 2 (Source: Factset; These are hypothetical returns and time periods shown are included strictly for illustrative purposes. These returns are not reflective of any investment strategy by the investment adviser nor are they the results of any client account managed by the adviser.)
Volatility Matters–Especially for Retirees
The reason bonds matter isn’t because they outperform stocks. They don’t–and they’re not meant to. Bonds provide balance. They reduce the portfolio’s volatility, they throw off steady cash flows, and–crucially–they give investors flexibility. In good markets, they may lag. But in bad markets, they help investors avoid panic selling, protect principal, and support distribution needs without forcing the sale of depressed assets. In the above example, where the 10-year cumulative return was negative, you can see how including bonds not only helped offset stock market losses but lifted the portfolio value well above the equities-only portfolio!
Be Careful Chasing Average Returns
For years, many of the big Wall Street companies have been promoting average annual returns with little explanation on the impact a down market has not only on one’s portfolio but also how average returns change significantly based on the most recent results. For example, the 20-year average return of the S&P 500 index ending in 2024 was 9.7%. This historically high return was due, in large part, to the most recent 3-to-4-year results. When investors see these high average annual returns and compare the portfolio to a balanced approach – where the return may be between 6 and 8% – this can often lead to a common mistake known as the “Recency Effect.” The Recency Effect is when investors adjust their allocations based on past results, often transitioning from a balanced approach to a more aggressive stance. Before you do this, you need to know that Wall Street fund companies often fail to show that average returns – while sometimes higher after a recent stock market rally – may look good but it doesn’t tell the whole story.
While it’s true that the 20-year average return of the S&P 500 (ending in 2024) was 9.7%, one needs to know that average returns are often quite different from constant returns. Average returns in the market are measured based on the average return with the inclusion of volatility (ie: down markets and recovery). In other words, there are interruptions in growth due to volatility. But with constant returns there is NO interruption. The absence of volatility implies no down markets nor down-market recoveries. So, why is this important? Because spreading risk in other asset classes – like bonds and other complementary asset classes which focus on minimizing volatility – means that your portfolio doesn’t have to perform as well to deliver the same dollar results!
The chart below illustrates this point:
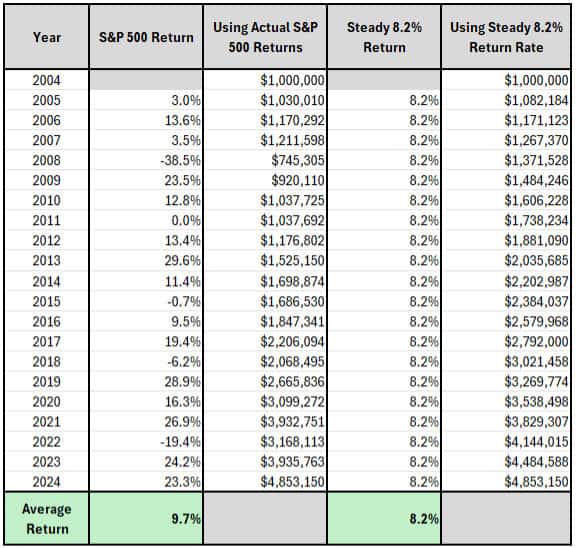
Exhibit 3 (Source: Factset)
As you can see, $1,000,000 invested in the S&P500 for 20 years ending on a rally produced 9.7% in average return results, or approximately $3.85 million dollars, while earning a constant 8% (with no volatility) produced the same amount! Let’s take this one step further: what do the average returns look like after the market went down?
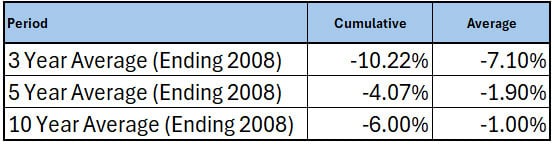
Exhibit 4 (Source: Factset)
As you can see, the average return of the S&P500 ending in 2008 produced a very different picture. The above 1,3- and 5-year average returns are clearly not impressive – and worse – the impact of the down market to an unbalanced portfolio (ie: one without bonds) will sting even worse. So, before you get too sold on the idea of getting out of bonds – or avoid adding to your existing bond position – consider their value as portfolio diversifier and their impact on average returns versus constant returns.
Related Articles

Building a portfolio with a correction in mind vs timing the correction
Investment Principles,
Markets,
Portfolio Considerations,
October 1, 2024

The Market Is Like a Coin—It Has Two Sides: Up and Down
Investment Principles,
Knowledge & Insights,
Markets,
Understanding Results,
September 17, 2024
Why to Invest in Bonds and Where to Buy Them
Fixed Income,
Why to Buy & Where,
September 24, 2024