

Taming the need for constant change.
Most investors desire a balanced approach, spreading risk across sectors and asset classes that complement each other over time. Unfortunately, all too often investors want to spread risk, but have little insight into the pros and cons of a balanced portfolio – especially in the short-term. A little insight can help long-term investors prevent short-term results from leading them astray.
10 Ways the Performance of an Efficient Portfolio can be Misunderstood
1. Comparing a balanced portfolio against the wrong benchmark(s).
When investors compare a balanced portfolio’s short-term returns compared to a benchmark like the S&P 500. During a rally in large-cap stocks, the 100% large-cap stock S&P 500 is almost always going to outperform a balanced portfolio that includes bonds and smaller stocks. Even so, a large-cap rally makes many investors want to increase their large-cap position – even if those assets are overheated.
2. Misunderstanding how short-term results impact average returns.
As sectors move up and down over the years, the results affect the 3-, 5-, and 7-year average returns and can mislead investors into changing their strategies. By moving from the worst-performing asset class to the best-performing asset class, they are chasing results rather than letting the results come to them.
3. Hot sectors, without quality earnings, often don’t end well.
History has shown us that hot growth, without the earnings to back it up, doesn’t last. There’s no better example of this than when the dot-com bubble burst. In the late 1990s the stock prices of dot-com companies grew significantly, several years in a row. This was despite companies like Webvan and Pets.com having no net profits at all. Eventually, the companies without earnings began to fail, drawing the NASDAQ down 75%. Investors who were chasing the unsustainable dot-com growth could have had huge losses.
4. How private fixed income can be misunderstood.
When one builds a private bond portfolio with direct ownership, the coupon payments and payment at maturity are generally fixed. Bond prices can go up and down, but if you’re holding your bonds to maturity your coupon payments and payment at maturity are fixed, so long as the company doesn’t default.
5. Results are directly related to sector tilt.
For example, the Linden Thomas All-Cap Growth 150 Index was up 43.99% in 2023, but a balanced portfolio might only have 20% of its assets in that index. While an allocation of 20% might be appropriate for many investors, if they compare the performance of their overall portfolio to the hot performance of one asset or group of assets they’ll usually be left disappointed.
6. A coin has two sides.
Like a coin, markets have two sides – rallies and pullbacks (bull markets and bear markets). When spreading risk across sectors and asset classes, investors should consider both sides of the coin before pursuing an aggressive strategy.
7. Long-term compounding is directly correlated to down-market recovery.
Down-market recovery performance impacts long-term compounding significantly. The quality of the portfolio determines whether it will recover quickly when the market goes down. This is known as a “flight to quality”. All too often investors only look at upside results, not realizing that long-term compounding means restoring principle after pullbacks. Boats without leaks float, while boats with holes sink. This is one of the many reasons our earnings focused equity strategies focus on earnings quality.
8. Short-term returns don’t mean long-term results.
Sectors go hot and then go not. It’s important to understand that what is hot now may not be hot later. For example, the below illustrates how the Linden Thomas & Co. All-Cap Growth 150 versus the Small-Cap Value index rotated from dominant to lagging, and vice versa.
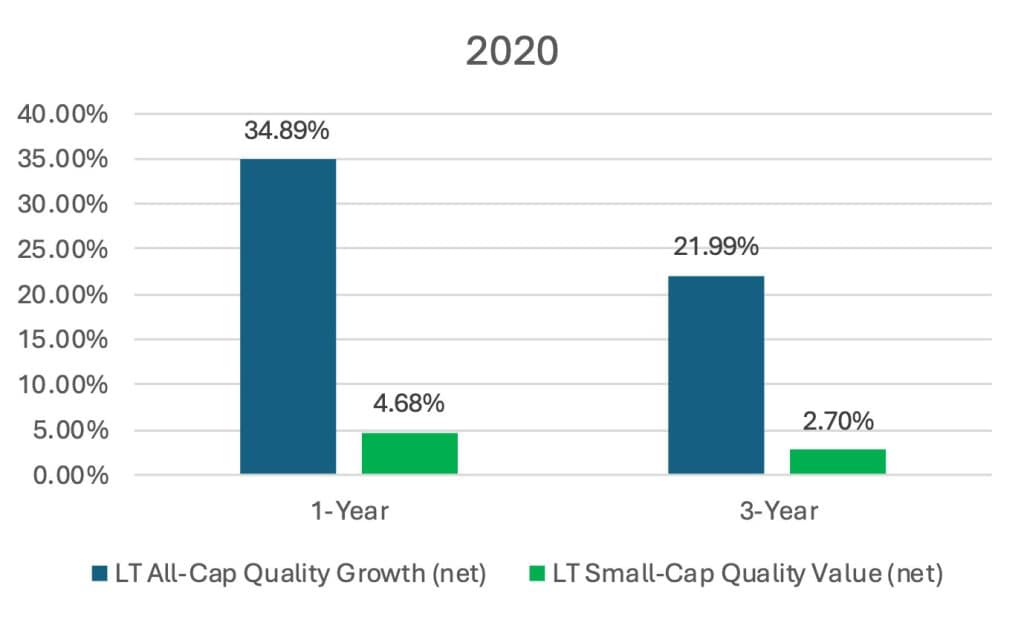
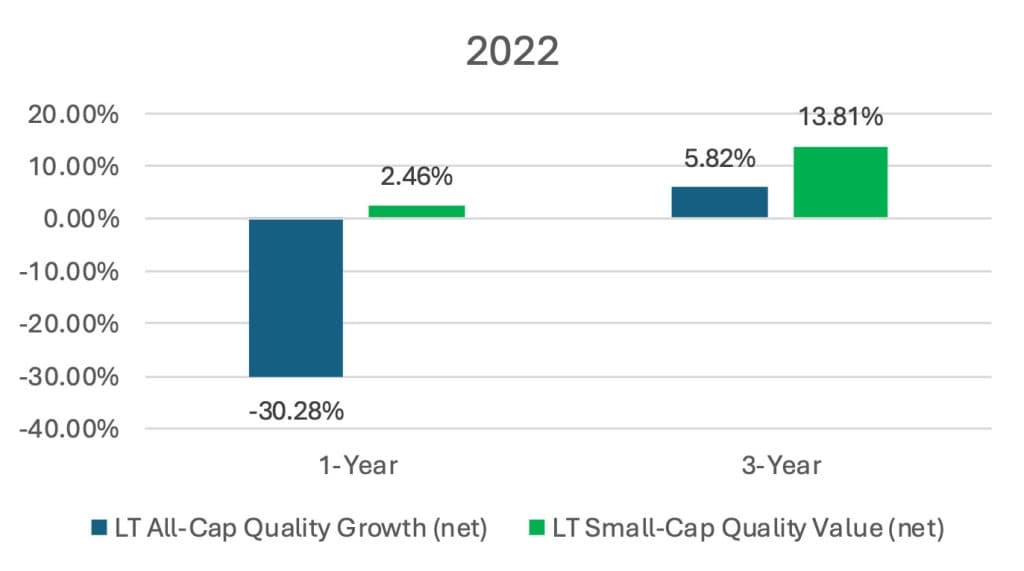
The performance results shown are those of a proprietary account at Linden Thomas invested using real dollars based upon the application of Linden Thomas’s Proprietary Linden Thomas All-Cap Quality Growth and Linden Thomas Small-Cap Quality Value 50 Index. These performance results are presented net of a .85% advisory fee. The performance results do not reflect the deduction of other fees or expenses, including but not limited to brokerage fees, custodial fees, fees and expenses charged by mutual funds and other investment companies, and any other fee or expenses a client may incur in the management of such client’s investment advisory account. A client’s return with respect to an investment would be reduced by any fees or expenses a client may incur in the management of its investment advisory account. The performance results are unaudited and are not an estimate of any specific investors actual performance, which may be materially different from such performance depending on numerous factors. No representations or warranties whatsoever are made by Linden Thomas or any other person or entity as to the future profitability of an investment account or the results of making an investment. Past performance is not a guarantee of future results.
9. Full Market Cycles are Important
A full market cycle can take 10+ years, covering up-markets, down-markets, and recoveries. Investor results aren’t achieved in just one cycle or over a short-period.
10. How sector rotation can change outcomes.
Sector rotation occurs when sectors move into or out of favor quickly. Unfortunately, the rallies and retreats can happen quickly and be short-lived. Chasing momentary rallies or declines often ends in failure. This is why risk should be spread across asset classes, and investors should wait for results rather than chasing them. Below you can see a sector quilt, with the black line through white squares indicating the performance of a balanced portfolio:
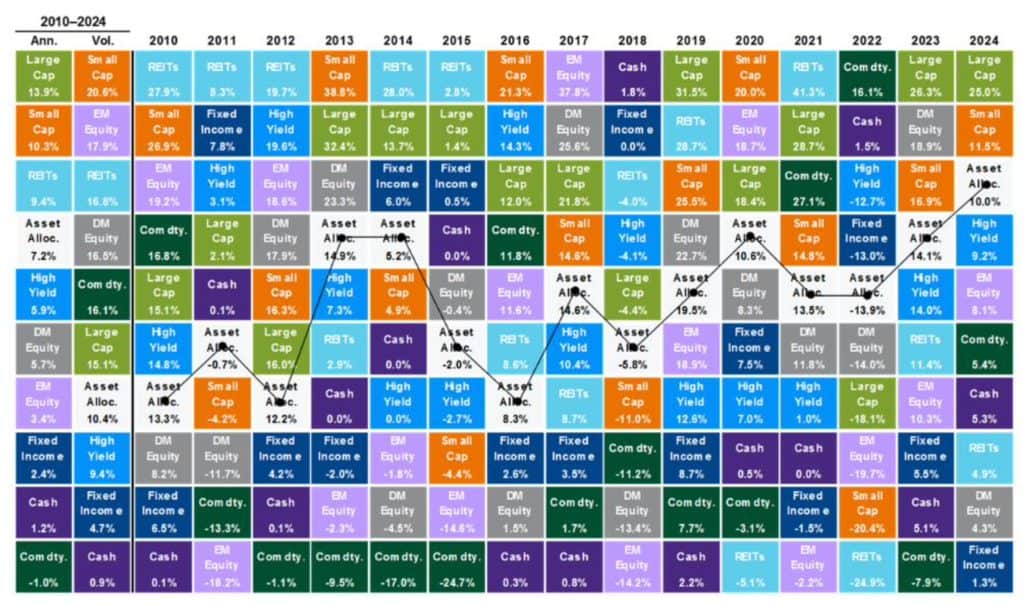
Source: Bloomberg, FactSet, MSCI, NAREIT, Russell, Standard & Poor’s, J.P. Morgan Asset Management.
Large cap: S&P 500, Small cap: Russell 2000, EM Equity: MSCI EME, DM Equity: MSCI EAFE, Comdty: Bloomberg Commodity Index, High Yield: Bloomberg Global HY Index, Fixed Income: Bloomberg U.S. Aggregate, REITs: NAREIT Equity REIT Index, Cash: Bloomberg 1-3m Treasury. The “Asset Allocation” portfolio assumes the following weights: 25% in the S&P 500, 10% in the Russell 2000, 15% in the MSCI EAFE, 5% in the MSCI EME, 25% in the Bloomberg U.S. Aggregate, 5% in the Bloomberg 1-3m Treasury, 5% in the Bloomberg Global High Yield Index, 5% in the Bloomberg Commodity Index and 5% in the NAREIT Equity REIT Index. Balanced portfolio assumes annual rebalancing. Annualized (Ann.) return and volatility (Vol.) represents period from 12/31/2009 to 12/31/2024. Please see disclosure page at end for index definitions. All data represents total return for stated period. The “Asset Allocation” portfolio is for illustrative purposes only. Past performance is not indicative of future returns.
Guide to the Markets – U.S. Data are as of December 31, 2024.
Each of the Linden Thomas & Co. private portfolios are built with a focus on high net cashflow and direct ownership, but without an investor’s patience even portfolio efficiency can’t stop results from being cut short. For example, below is an illustration of the Linden Thomas & Co. All-Cap Growth 150 Index in comparison to the S&P 500:
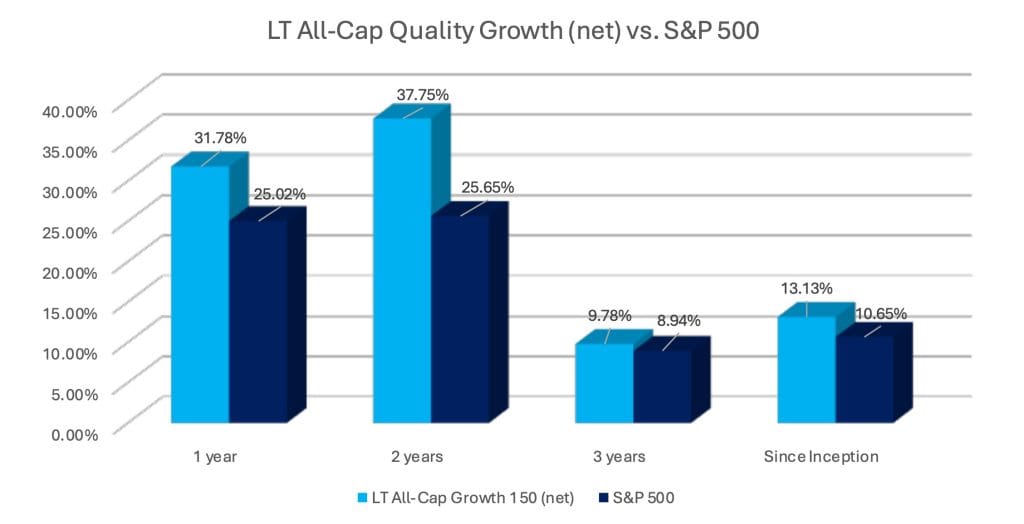
You cannot invest directly in an index. The performance results shown are those of a proprietary account at Linden Thomas invested using real dollars based upon the application of Linden Thomas’s Proprietary Linden Thomas All-Cap Quality Growth 150 Index. These performance results are presented net of a .85% advisory fee. The performance results do not reflect the deduction of other fees or expenses, including but not limited to brokerage fees, custodial fees, fees and expenses charged by mutual funds and other investment companies, and any other fee or expenses a client may incur in the management of such client’s investment advisory account. A client’s return with respect to an investment would be reduced by any fees or expenses a client may incur in the management of its investment advisory account. The performance results are unaudited and are not an estimate of any specific investors actual performance, which may be materially different from such performance depending on numerous factors. No representations or warranties whatsoever are made by Linden Thomas or any other person or entity as to the future profitability of an investment account or the results of making an investment. Past performance is not a guarantee of future results.
As you can see, over time the All-Cap 150 did quite well. At the core of each efficient portfolio is direct ownership, quality holdings, balance across sectors, and yield-focused bonds. However, efficient portfolios still require time to perform.
Related Articles

Building a portfolio with a correction in mind vs timing the correction
Investment Principles,
Markets,
Portfolio Considerations,
October 1, 2024

How do I build an Investment Portfolio?
Investment Principles,
Personal Finance,
Portfolio Considerations,
Top Personal Finance FAQs,
June 24, 2024

How Quality of the Portfolio Impacts Down Market Recovery and Compounding
Investment Principles,
Top Investment Principles FAQs,
January 15, 2025