

By Indexopedia Research Team | October 15, 2024 | In
Investors are often quick to measure their portfolio’s performance against well-known stock market benchmarks like the S&P 500 Index or the Dow Jones Industrial Average (DJIA). These indices, with their high visibility and representation of the broader market, are used as a yardstick by many–even when their portfolios are based on entirely different strategies. This habit of comparing apples to oranges, particularly when portfolios are structured with specific goals or asset classes in mind, can create dissatisfaction, second-guessing, and poor investment decisions.
The Popularity of the S&P 500 Index and Dow Industrials Average
The S&P 500 Index and DJIA are two of the most widely recognized indices in the financial world. The S&P 500 Index, consisting of 500 large-cap U.S. stocks, is often viewed as a proxy for the overall stock market’s health. Similarly, the DJIA tracks the 30 largest and most influential American companies. When these indices perform well, it grabs headlines, naturally drawing investors to use them as a comparison for their portfolios, regardless of whether their investment strategy aligns with large-cap U.S. equities.
However, many investors hold diversified portfolios that include other asset classes such as mid-cap stocks, small-cap stocks, bonds, or alternative investments. These portfolios, constructed for long-term goals, risk management, or income generation, may be designed to produce different returns than the large-cap companies dominating the large cap indices. Comparing such portfolios to these benchmarks creates a skewed view of performance, leading investors to question their investment choices.
Misguided Comparisons: The Impact of Different Investment Strategies
A classic example is an investor in a mid-cap growth fund benchmarked against the S&P 500. Mid-cap stocks have different risk and return characteristics compared to the large-cap stocks that make up the S&P 500. Mid-cap stocks tend to be more volatile and may offer higher growth potential, but during periods when large-cap stocks outperform, a mid-cap investor might feel disappointed. This feeling is compounded when large-cap stocks–especially tech companies–experience periods of booming returns, such as in 2023 and 2024, when companies like Apple, Amazon, and Nvidia surged while mid-cap stocks lagged.
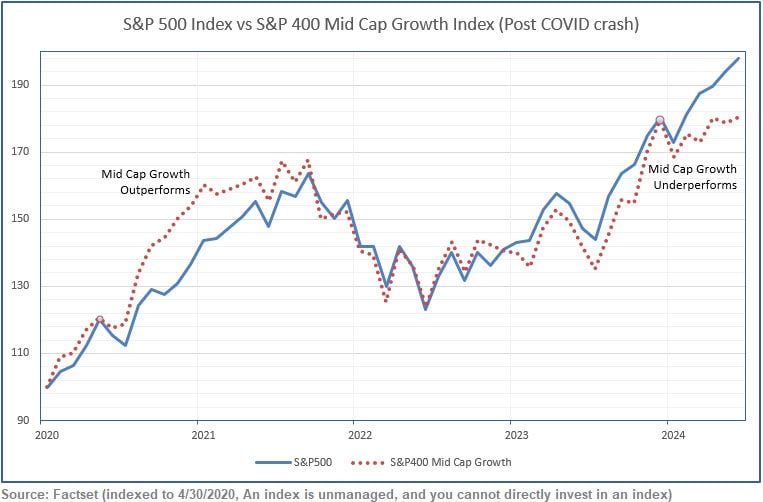
Exhibit 1
Let’s take a low-volatility bond portfolio as another example. A bond investor might compare their bond portfolio’s performance to the S&P 500 during a bull market, where stocks are delivering double-digit returns. Typically, a bond portfolio, which is designed to offer stability and modest income, underperforms during these periods, leading an investor to feel disappointed, even though the investment is delivering exactly what it was designed to: lower risk and consistent income.
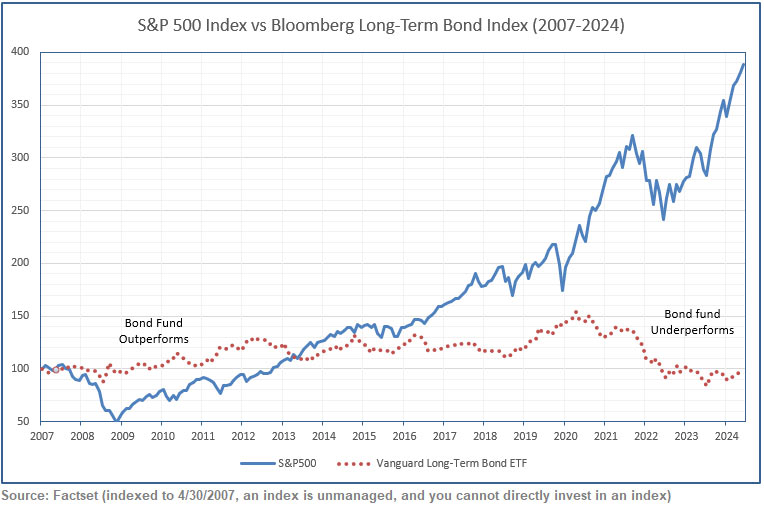
Exhibit 2
The Risk of Second-Guessing Allocations
Investors who rely on inappropriate benchmarks for comparison may develop what’s known as “benchmark envy”–a tendency to feel that their portfolio is underperforming when it’s merely following a different risk/return path. When the S&P 500 Index surges, investors in diversified portfolios might second-guess their allocations, asking questions like:
- “Should I be more heavily invested in U.S. large-cap stocks?”
- “Why didn’t I put more money into tech stocks?”
- “Am I missing out on the broader market rally?”
Such thoughts can lead to portfolio adjustments at the wrong time, usually by overweighting into the sector or asset class that just experienced significant gains. Investors may chase returns and sell out of their diversified, strategy-specific portfolios, in an attempt to follow the “winning” benchmark–potentially exposing themselves to higher risk – or underperformance.
Examples of Misaligned Comparisons
Let’s look at another common example: international equities. Suppose an investor holds an international stock portfolio but benchmarks against the S&P 500 Index. International stocks and U.S. large-cap stocks often experience different performance cycles due to differences in currency rates, economic growth, and market conditions. A chart comparing the performance of international stocks versus U.S. large-caps would reveal periods when one outperforms the other. An international fund might be underperforming the S&P 500 during a U.S. bull market, but that doesn’t mean the investment is a failure–it’s simply following a different trajectory.
Similarly, consider a small-cap stock investor during 2020. While large-cap tech stocks were dominating, small-cap stocks took a hit. However, by late 2020 and into 2021, small-caps began to outperform large-caps as the economic recovery gained momentum. Investors who stuck with their small-cap strategy benefitted over the longer term, but those who compared their small-cap portfolios to the S&P 500 throughout 2020 might have been tempted to sell prematurely.
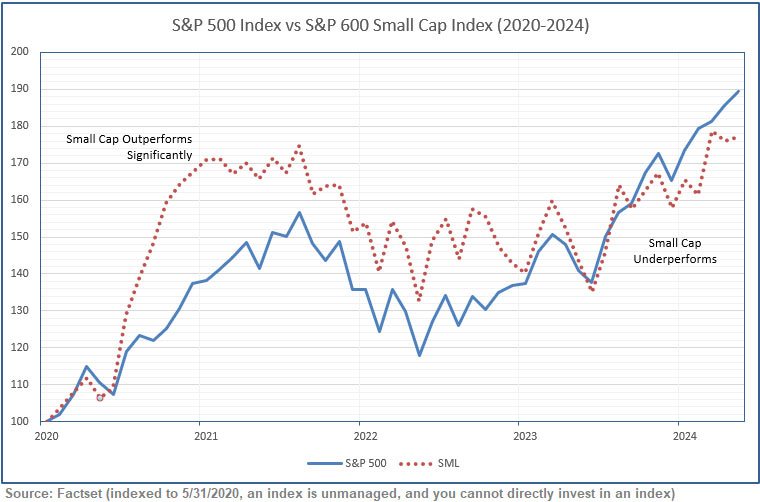
Exhibit 3
The Importance of Using Correct Benchmarks
Every investment strategy should have a specific risk and return profile, which is why choosing the right benchmark is critical. Here are a few examples of how different benchmarks align with various strategies:
- S&P 500: U.S. large-cap stocks
- Russell 2000: U.S. small-cap stocks
- MSCI EAFE: International developed markets
- Barclays U.S. Aggregate Bond Index: Broad U.S. bond market
If you have a portfolio diversified across several asset classes, you might even use a blended benchmark that reflects your asset allocation more accurately. For example, a portfolio that’s 60% stocks and 40% bonds could be benchmarked against a 60/40 index that mirrors this balance, rather than an all-stock index like the S&P 500.
Tax-Efficient Investing as Another Consideration
Another layer of complexity is the role of tax efficiency in portfolio returns. Many diversified portfolios include tax-efficient investments like municipal bonds, which generate lower returns than equities but offer substantial tax savings. Comparing a tax-advantaged bond portfolio to the S&P 500 ignores these tax considerations, distorting the true value of the investment strategy.
Low turnover strategies are another category of tax efficient investing. These strategies focus on delivering admirable results without excessive turnover. This can lower the investor’s tax liability and, when compared to the net (after-tax) performance of a standard investment strategy, may meet or exceed those results.
Avoiding the Perils of Benchmark Misconceptions
To help avoid the pitfalls of comparing your portfolio to an inappropriate benchmark, consider the following steps:
- Understand Your Investment Strategy: Whether you’re investing for growth, income, or a mix of both, your portfolio should be aligned with your financial goals and risk tolerance. Know the benchmarks that represent the asset classes in which you’re invested.
- Stay the Course: In periods of market volatility, it’s tempting to chase returns, but long-term investing success is often more about maintaining discipline and not overreacting to short-term performance relative to the broader market.
- Use Appropriate Benchmarks: If you’re invested in bonds or alternative asset classes, don’t compare yourself to the S&P 500. Use benchmarks that reflect your strategy–whether it’s the Barclays Bond Index, a small-cap index, or an international index.
- Consider Professional Guidance: A financial advisor can help you better understand the role of benchmarks in evaluating your portfolio’s performance, ensuring that your comparisons are relevant and accurate.
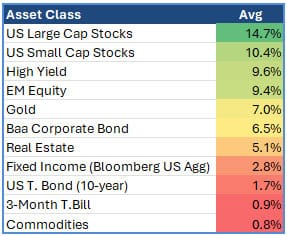
Exhibit 4: Average Annual Asset Class Returns 2009-2023 (Source: Factset, JP Morgan, FRED)
Comparing portfolio performance to a general market index like the S&P 500 or Dow Jones Industrial Average can lead to faulty perceptions, especially when your investments are geared toward different objectives. By using the right benchmark, you’ll have a more accurate picture of your investment’s performance and can help avoid making emotional, short-term decisions that can harm your long-term growth potential.
Related Articles
What is the Difference Between Market-Cap Index Funds and Equal Weighted Index Funds?
Investment Principles,
November 19, 2024

Benchmarks
Index Investing,
Investment Principles,
Types of Indexes,
November 2, 2023

What are Rallies, Pullbacks, and Average Returns?
Investment Principles,
Top Investment Principles FAQs,
Understanding Results,
November 3, 2023