

Portfolio results have a direct correlation to portfolio efficiency. Portfolio efficiency–or portfolio construction–is a primary driver of long-term results, which is the foundation of the Linden Thomas & Co. earnings-focused indexes and private bond portfolios. But what about behavior? Behavioral biases drive investors to make decisions that may jeopardize results due to making the wrong decisions. At the core of every investor, one needs portfolio efficiency! But portfolio efficiency does not ensure results if smart investor behavior doesn’t backup efficiency.
So, what is at the core of bad investor behavior? Chasing results! Chasing past results has proven to be the worst thing any investor can do. Often at the core of chasing average results–or what influences investors the most–is seeking to achieve the best returns but not understanding the LIE of average returns!
Big Wall Street fund companies have for decades used average returns to attract new investors or keep the ones they have by promoting average returns, yet seldom–if ever–explaining the impact that down markets and volatility have on portfolio value, compared to a portfolio with less return and minimal volatility. So, our team and Indexopedia stepped up to set the record straight.
But first, as an investor, which would you prefer?
Which Would You Prefer? A Larger Portfolio Value or Higher Returns?
While some would seek higher returns, most of us would rather have a higher value. Unfortunately, those who seek higher returns often fail to achieve a higher portfolio value. Why? As big fund companies promote average returns, what they seldom explain is how volatility, or down markets, and delayed recovery impact portfolio value.
One of the most significant examples of this is the more than $5 trillion dollars in S&P 500 index funds. While the average annual return of the S&P 500 from 2004 to 2024 was approximately +9.5%, what investors aren’t being told is how volatility and down-market recovery impact value. Let’s look at volatility and its impact on dollars over a 20-year period.
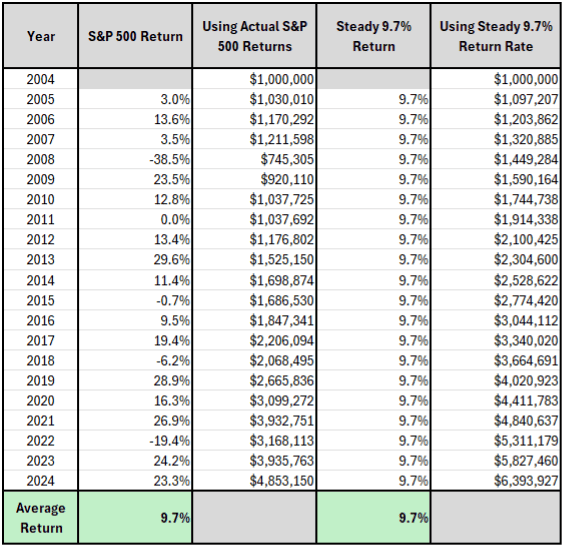
As you can see from the above (Exhibit 1), $1 million invested in the S&P 500 with no fund or advisor fees would have become $4.7 million, and the average annual return would have been +9.5%. Meanwhile, the same $1 million invested at the same +9.5% with no volatility would have become $6.1 million–a difference of $1,425,195.00, or 140% enhanced results. So, if one had insight into this result, one might say understanding volatility is important.
Insight into Down Market Recovery and Compounding
What drives portfolio value is compounding! The value of a portfolio does not increase when it’s in a state of down markets and recovery. Simply, if you have a dollar and it earns a dollar, that’s compounding: 1 + 1 = 2. However, if your dollar goes down to $0.50 and then earns $1: 0.50 + 1 = 1.5 — that’s negative compounding.
So why is this fundamentally important? Because we as investors all desire the same thing–and that is to retire with more dollars.
So, what impact does a down market or volatility have on a portfolio? Let’s look at the table below:
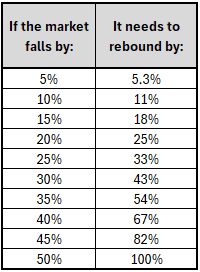
As you can see, when down markets prevail, the climb back to breakeven in order to restore compounding can be significant. If a portfolio falls 30%, then to restore compounding, it must go up +43%. And if moving up +43% takes several years, then as an investor, you will spend years just trying to get back to the point where you’re making money again.
Average Returns Are Not Equal
Historically, investors buy investment products like index funds based on average returns without any consideration of how compounding really works and its impact on portfolio value. When an investment fund promotes average returns yet doesn’t give insight into down markets and recovery, then you’re not getting the whole picture.
Back to the S&P 500: a +9.5% average return from 2004 to 2024. If, as an investor, you could earn a higher dollar amount with less risk and better down-market recovery over a long period of time, then you’d win the race in value. Review the below:
+8.5% Average With No Volatility vs. S&P 500 At +9.5% Average
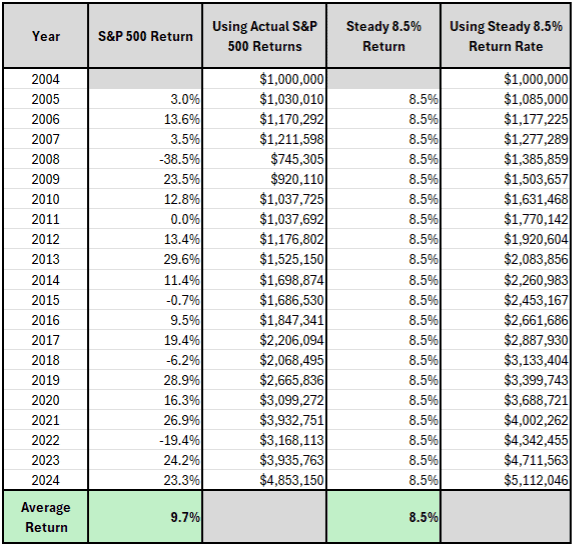
As you can see, a million invested at 8.5% with no volatility still outperformed the S&P 500 by over 5% during the 20-year period ending in 2024. But 2023 and 2024 were above the norms and would have inflated the S&P 500. What if you reviewed a 20-year period ending in 2022, which may give more insight into the relationship between risk, volatility, and results versus the 8% with no volatility?

As you can see, the value difference is significant.
With the above example: How low can average return be with no volatility and still achieve the same portfolio value?
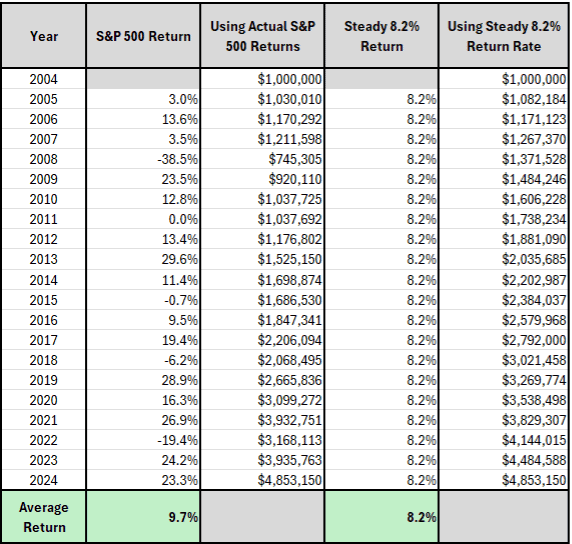
As you see, compounding a portfolio at +8.2% with no volatility will keep up with the S&P 500 from 2004 to 2024 (+9.7%).
The Three Ingredients of Compounding
Compounding is made up of 3 factors: upside, downside, and down-market recovery! Of these, the most important is downside and down-market recovery. Why? Because as soon as a portfolio goes down and fails to recover, compounding is interrupted.
Unfortunately, big Wall Street fund companies spend most of their time promoting average returns–not compounding value. Why? This is only speculation, but first, it’s too hard to explain or educate most investors. And second, most of the industry’s large index providers build funds based on size requirements, not earnings quality. Without a focus on the quality of holdings, down markets and recovery are not always optimized.
So back to the 3 factors of compounding:
- Upside Capture – the measure of how much your portfolio goes up when the market moves up.
- Down Market Capture – the measure of how much your portfolio goes down when the market goes down.
- Down Market Recovery – the measure of how quickly your portfolio recovers compared to the market after a downturn.
So as an investor, if you do well on the upside–and in down markets you go down less and recover quicker–then you’re going to do better than someone who may have better upside (or average annual returns) but worse downside and recovery. Remember, principal recovery is where compounding begins.
How Do Investors and Investment Companies Leverage This Information?
As an investor, you need to understand that average returns don’t paint the whole picture. In fact, many companies or advisors who sell average returns may be cutting shy of the whole truth. You need to consider the quality of the portfolio, its efficiency, and its impact on long-term compounding.
The takeaway: If your portfolio is built efficiently, then you may not need to chase returns or take on excess risk and long recovery periods.
As for investment products or fund companies: many of Wall Street’s index funds were established in the 70s and 80s. They were built as market-cap-weighted index funds with the primary goal of giving small investors access to the overall stock market with lower minimums. In the case of the S&P 500 index funds, they opened the door for small investors to invest in all 500 stocks with a small amount of money.
This passive index approach was launched because quality and recovery were not at the center of the theme, and the technology didn’t exist to build an index based on earnings quality. So instead, size of company, passive structure, and broad access became the thesis.
Fast forward to building earnings-focused indexes.
The Launch of Earnings-Focused Indexes
Because earnings quality of holdings, direct ownership, and cost really do matter to investor compounding, Linden Thomas & Co. and its team set out to build an institutional index focused on company earnings quality, giving investors direct ownership, and minimizing the hidden costs of retail investment products.
Because results have a direct correlation to portfolio efficiency, we set out to build indexes that consider all compounding factors–upside, downside, and down-market recovery. This empowers investors who seek strong long-term results with less downside and quicker recovery.
Related Articles
What are Rallies, Pullbacks, and Average Returns?
Investment Principles,
Top Investment Principles FAQs,
Understanding Results,
November 3, 2023

How Do Recent Returns Impact Average Returns?
Investment Principles,
Top Investment Principles FAQs,
Understanding Results,
November 19, 2024
What Happens When Average Returns Flip?
Markets,
February 11, 2025