
All investors seek to achieve the best results! And it’s always been the goal of large Wall Street fund companies to lure investors based on average returns. The lure is often done through average return results. One example is passive market cap index funds. Originally created in the 1970s, market cap index funds were created as a basket of non-managed equities so investors could access a large group of companies so that they could invest in hundreds of stocks without needing the capital to actually buy each company’s stock individually.
As an example, the S&P 500 index: instead of buying all 500 stocks, investors can buy an index fund and own a stake in all 500 with one purchased share of the index fund. For years, large index fund companies have lured investors based on the ease and average annual returns these funds offer. Unfortunately, the promise of high returns often doesn’t deliver the best portfolio results, because average returns are somewhat window dressing. In fact, some would say showing average returns without showing the impact of volatility is only just short of a LIE!
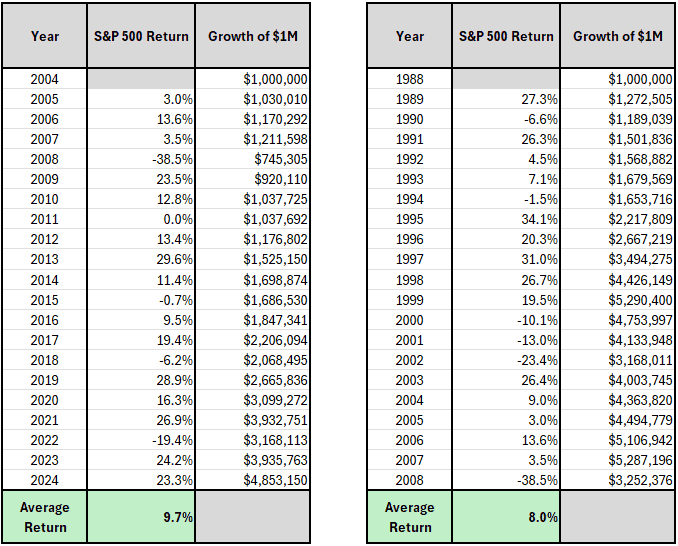
Take the example below:
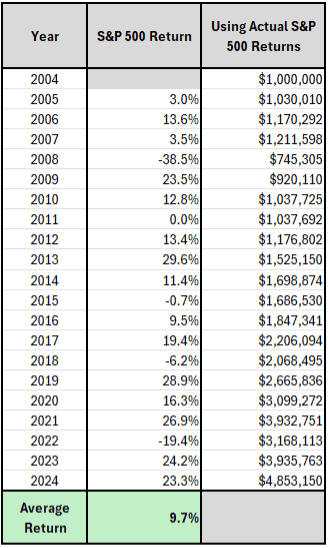
As you can see from the above chart, from 2004-2024, the S&P 500 index (excluding any fees of index funds or advisors) would have had a simple average annual return of +9.7%. One million invested over that time, with no investment cost, would have grown to $4.85 million–or total growth of $3.85 million. Many investors would say that’s satisfactory.
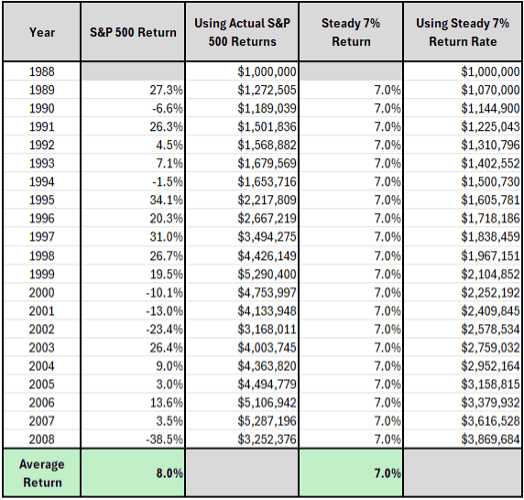
However, what if you take the same time period and earn the same +9.5% at a steady return? Take the example below:
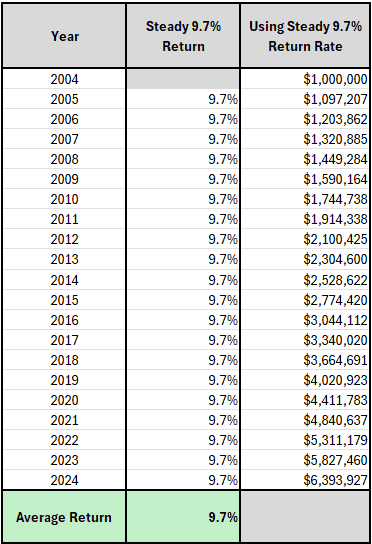
As you can see from the chart below, the steady return vs. the simple average return delivered a $1.5 million difference–or $6.4 million over the $4.85 million value invested in the S&P 500 over the same period of time. Considering you only invested $1 million–and as investors you would have achieved $1.5 million in better results–it raises a lot of questions. So, let’s look further into the impact of risk and how it affects dollar results.
What’s more important – a higher return or a larger portfolio?
What many large fund companies may fail to clearly disclose is the impact volatility or down markets have on investors’ portfolio values. In many ways, when companies and retail investment advisors use average returns to lure investors into investments, they don’t always understand–or maybe don’t disclose–the whole truth of down markets and recoveries.
Average returns, without showing the whole picture of down markets and recovery, can be misleading and even cause investors to take unnecessary risks in order to seek higher results. With over $5 trillion in market cap index funds across the country, it’s a wonder if anyone understands the realities of volatility.
To demonstrate what I’m talking about, let’s say you had averaged an 8.2% return over the same 20-year period, and you see an advertisement with a 9.7% return over that same period. Your first thought runs to “Why didn’t I do better?”–and maybe you should. But let’s say you move from your current portfolio into an advertised index fund. You change direction and jump in not realizing that simple average returns are very different from steady compound returns. Take the example below:
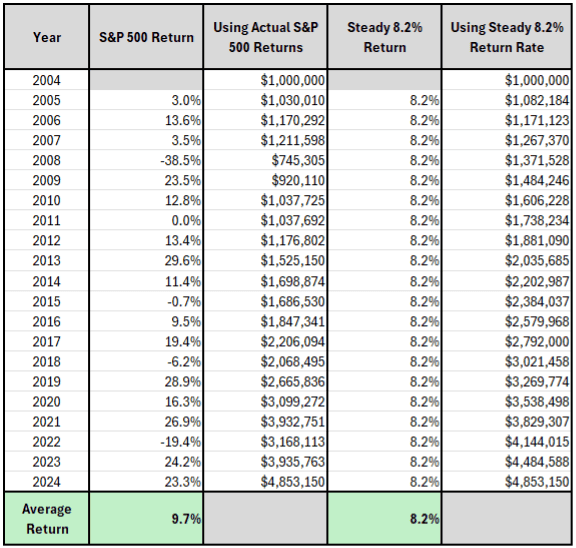
As you can see from the above, a $1 million portfolio produces the same dollar results at a steady return of 8.2% compared to 9.7% over the same period using the S&P 500 index. Why? Because the volatility of a market cap index fund, defined by down-markets and recoveries, does impact portfolio values.
The more volatility you take out of a portfolio, the more you enhance compounding. Compounding only exists if the value of the portfolio stays intact. A dollar added to a dollar equals two. But if the portfolio goes down, then compounding is lost. This is why some believe that selling average returns is often misleading.
Consider the following chart: These are two very different periods, one ending in an up year, the other ending in a down year.
As you can see, while both are different time periods, the average returns and values are significantly different. The sad reality is many investors may seek the higher returns of index funds yet find that volatility can dramatically change the outcome in results.
So, let’s look at one more example of how portfolio values are impacted by volatility versus a market cap index fund using the 20-year time period ending at the end of 2008.
As you can see from the above chart, the average return of the S&P 500 ending in 2008 grew the $1 million investment to $3.2 million. However, if one were to take out volatility and earn a steady return of 7%, the impact on value is significant.
The Whole Truth!
The whole truth is average returns don’t tell investors the whole truth. The whole truth is that volatility in market cap index funds can be painful, especially if one seeks to achieve average returns, only to find the value of the portfolio is impacted negatively.
The whole truth is that investors who want higher long-term values should consider the following factors before investing–upside, downside, and down-market recovery. When considering these three factors, one may note that down market impact and recovery are the essentials to compounding value or achieving steady values.
The key is: one does not need to achieve high average annual returns if down market impact and recovery are minimized. Simply, when one’s values are interrupted, so is compounding. The example below illustrates this point.
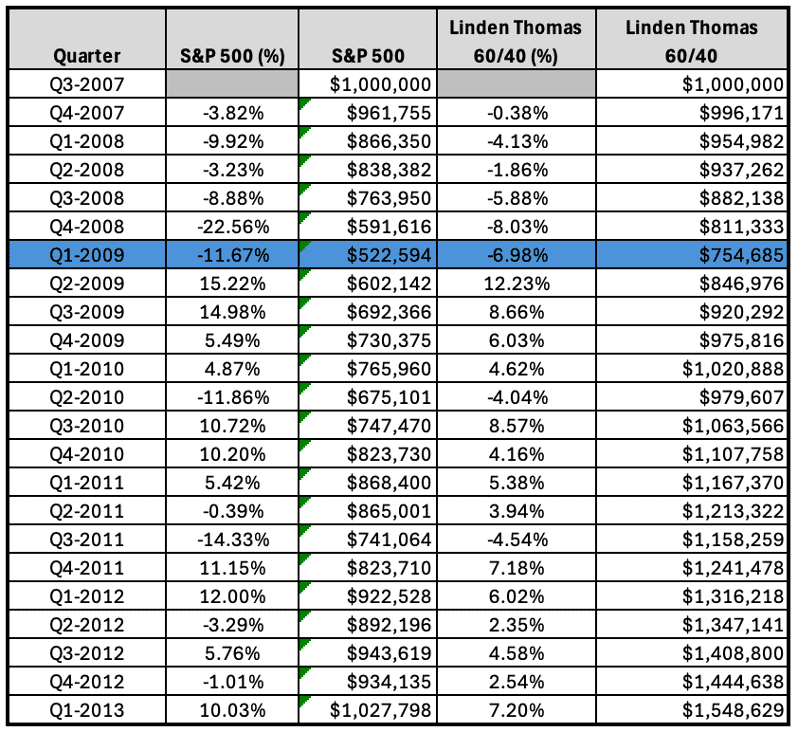
As one can see, from October of 2007 to March of 2009, the S&P 500 index went down -47%, in other words, a $1 million portfolio was reduced to about $523k. At that point, compounding or adding value no longer existed. Further, by the time the S&P 500 recovered back to principal in March of 2013, the value of the conservative portfolio was worth well over $1.5 million!
So, if investors seek more dollars over average returns and would like to have less volatility, how does one seek answers?
Breaking Tradition
Our team at Linden Thomas & Co. broke tradition to build a more efficient index that moves away from the shortfalls of market cap indexes, with a focus on enhancing long-term compounding. This undertaking meant that we needed to address all three dynamics of compounding: first, upside, second, downside impact, and third, down market recovery.
While some investors may try to enhance compounding through adjusting their portfolio allocation, this only solves a very small part of what’s needed – much like getting an oil change when you need a whole new engine. Enhancing long-term compounding means opening the hood and removing or fixing parts that impact all three factors – so that upside is maximized, downside is minimized, and down-market recovery is shortened.
This is what set us on our journey to build an enhanced index. The goal: move away from selling average returns and instead focus on building efficient portfolios with a focus on efficiency–tailoring each portfolio with our clients’ portfolio values in mind.
Building a More Efficient Index
Because earnings quality of holdings, direct ownership, and cost really do matter to investor compounding, Linden Thomas & Co. and its team set out to build an institutional index focused on company earnings quality, giving investors direct ownership, and minimizing the hidden costs of retail investment products.
Because results have a direct correlation to portfolio efficiency, we set out to build indexes that consider all compounding factors–upside, downside, and down-market recovery. This empowers investors who seek strong long-term results with less downside and quicker recovery.
Related Articles
What are Rallies, Pullbacks, and Average Returns?
Investment Principles,
Top Investment Principles FAQs,
Understanding Results,
November 3, 2023

How Do Recent Returns Impact Average Returns?
Investment Principles,
Top Investment Principles FAQs,
Understanding Results,
November 19, 2024
What Happens When Average Returns Flip?
Markets,
February 11, 2025