

Trying to time the stock market is like trying to catch lightning in a bottle – tempting, but statistically doomed to fail. While the concept of “buy low, sell high” seems intuitive, the reality is that predicting market tops and bottoms with any consistency is virtually impossible, even for professionals. In this article, we’ll break down why market timing doesn’t work, using real-world examples, data from major recoveries, and insights from investor behavior research.
The Illusion of Market Timing
Market timing is the strategy of moving in and out of the market based on predictions about future price movements. It sounds simple: sell before a downturn and buy back in before the rebound. But here’s the catch – you have to be right twice.
First, you must correctly call the top. Then, perhaps even harder, you must perfectly time your re-entry before the market surges again. Miss either side of that equation, and you risk doing far more harm than good to your long-term returns.
The High Cost of Missing Just a Few Days
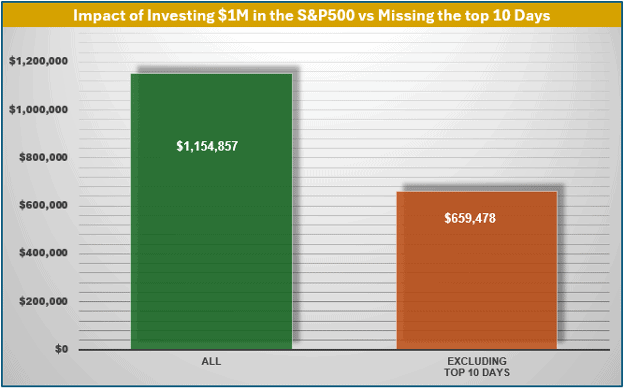
Let’s get straight to the numbers. From January 2010 through June 2024, the S&P 500 returned nearly 12% annually. But if you missed just the 10 best days in the market during that time? Your return drops to just 5.7% – a loss of more than 6% per year.
Why does this happen? Because the best days in the market often follow the worst. Investors who panic and exit during downturns often miss the swiftest parts of the rebound. History shows this time and again.
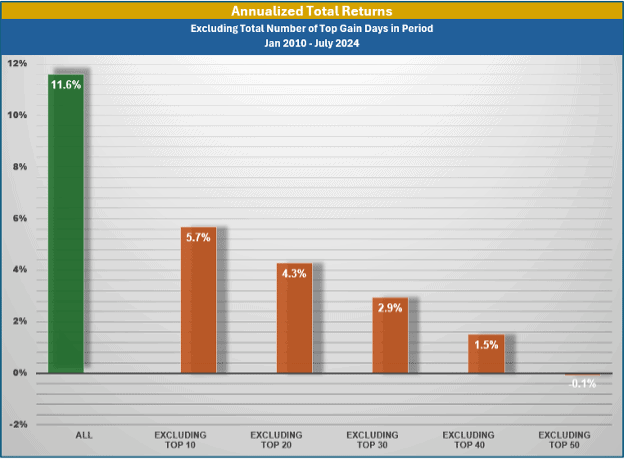
(Exhibit 1, Source: Factset)
Five Times Market Timing Would Have Failed Miserably
Let’s look at real historical examples where market timing backfired badly:
1. Dot-Com Bubble Recovery (2002-2007)
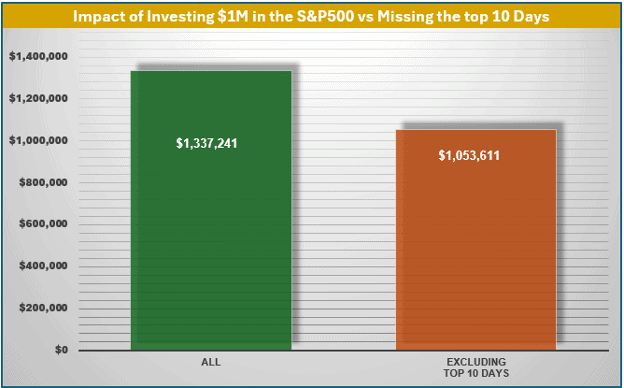
After a nearly 50% drop, the S&P 500 doubled from its 2002 bottom by 2007. Investors who stayed in cash until late 2003 missed most of the rebound.
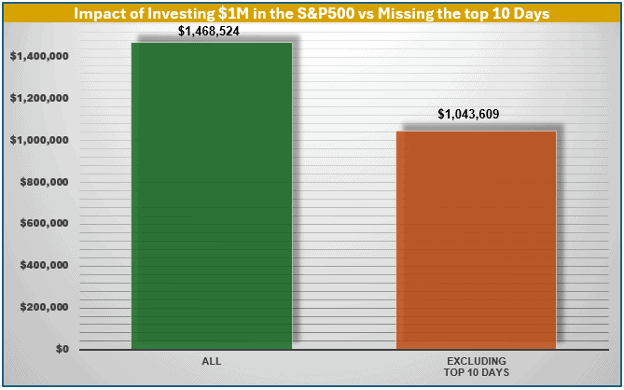
(Exhibit 2, Source: Factset)
Cost of missing 10 best days: 29%
2. Global Financial Crisis (2009–2014)
The S&P 500 bottomed in March 2009 and doubled by 2014. Investors who waited for things to “feel better” missed massive gains.
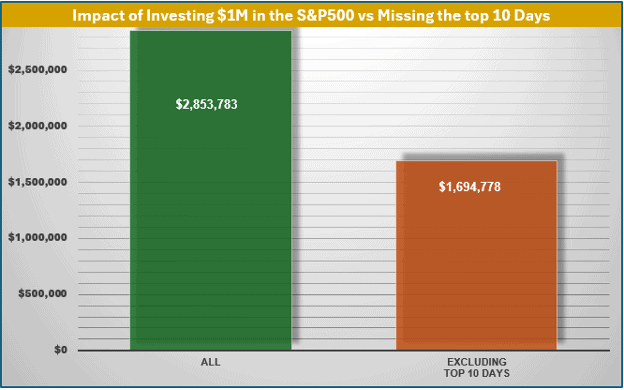
(Exhibit 3, Source: Factset)
Cost of missing 10 best days: 41%
3. Trade War Panic (2018)
A 20% decline in late 2018 gave way to a 25% rebound by July 2019. Investors who fled the market missed the rapid bounce.
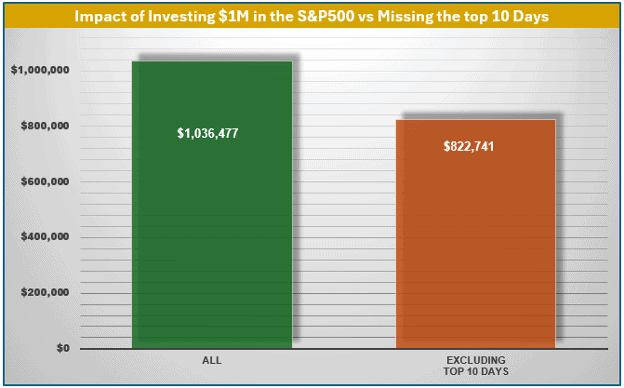
(Exhibit 4, Source: Factset)
Cost of missing 10 best days: 21%
4. COVID Crash & Recovery (2020)
In March 2020, the market fell 30% in a matter of a few weeks. By year-end, it had recovered more than 60%. The fastest part of the rebound happened within months.
(Exhibit 5, Source: Factset)
Cost of missing 10 best days: 43%
5. Bear Market of 2022
After a sharp drop in the third quarter of 2022, markets began rebounding by the middle of the following year. Investors who sat on the sidelines until the end of 2023 missed out on a 21% recovery.
(Exhibit 6, Source: Factset)
Cost of missing 10 best days: 21%
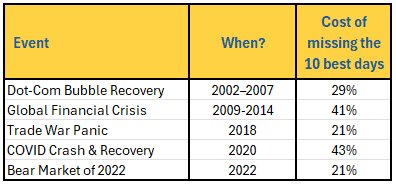
(Exhibit 7, Source: Factset)
Behavioral Science Backs It Up
The Dalbar Quantitative Analysis of Investor Behavior tracks how the average investor performs relative to the market. Over the 20 years ending in 2020, the S&P 500 returned 7.47% annually. The average equity investor? Just 5.96% – a performance gap largely driven by poor market timing decisions.
This shows that even if you have a sound investment strategy, emotionally driven decisions – fear in downturns and greed in upswings – can erode your returns.
Why Time in the Market Beats Timing the Market
Rather than trying to outsmart the market, a better approach is to stay the course with a disciplined, diversified strategy. For example, a 60/40 portfolio (60% stocks, 40% bonds) can offer investors a more stable growth trajectory with better downside capture and quicker recovery.
During the 2008–2009 crisis, a 60/40 investor saw far less of a drop than a 100% stock investor and recovered faster. In fact, it took the 100% stock portfolio below 29 quarters before surpassing the value of the 60/40:
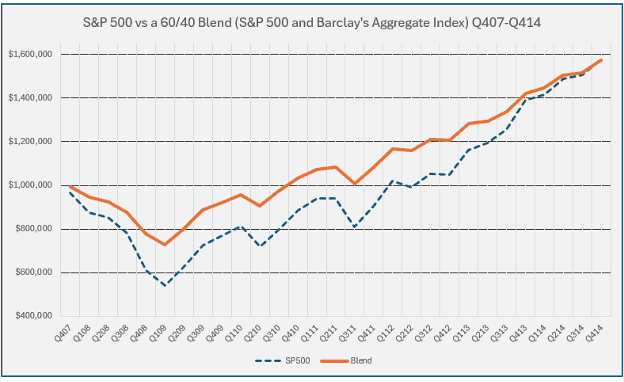
(Exhibit 8, Source: Zephyr)
The same was true during the COVID crash, where bond exposure softened the blow and allowed for quicker recovery without drastic action.
Strategies to Avoid the Market Timing Trap
To stay invested without the emotional toll of volatility, consider:
- Dollar-Cost Averaging (DCA): Invest the same amount regularly. This strategy removes the guesswork for how to deploy cash and can lower the average cost over time.
- Diversification: Spread your risk across asset classes, sectors, and geographies. It won’t eliminate downturns but can reduce their impact.
- Portfolio Rebalancing: Rebalance periodically to maintain your desired risk profile. This disciplined approach can also result in buying low and selling high – without having to time it.
- Buy High Quality: Unlike passive index funds that hold stocks based on size, a quality focused portfolio benefits from the flight to safety in down-markets and tends to do better over time.
- Behavioral Guardrails: Create a long-term plan and stay the course. Accept that market ups and downs are a natural part of the process and build the portfolio with volatility in mind.
Conclusion: Discipline Wins
The data is overwhelming, and the real-world examples are clear: Market timing doesn’t work. Missing just a few days can cost you thousands. Long-term investors are better served by staying the course, using time-tested strategies like spreading risk, dollar-cost averaging, and buying high quality.
Remember: The market doesn’t reward those who try to outguess it – it rewards those who endure it.
Stay invested. Stay disciplined. That’s how you win over time!
Related Articles

What is Timing the Market?
Investment Principles,
Markets,
Top Investor Mistakes,
Top Markets FAQs,
November 3, 2023
3 Factors of Compounding: Upside, Downside, and Recovery
Investment Principles,
March 28, 2025
The Dangers of Negative Compounding
Behavior,
Financial Planning,
Investment Principles,
Personal Finance,
December 10, 2024