
2025 was a strong year for large-cap stocks. The Vanguard 500 Index was up +17.71% while the Linden Thomas & Co. Large Cap Quality Growth Index was up +20.50%. While both portfolios had solid years, one should seldom abandon a balanced approach or chase what’s already taken place. In this review, we’ll explore why recovery time—not headline returns—is the true engine of long-term compounding, and we’ll use real market data to prove it.
The Three Factors of Long-Term Compounding
All too often, when investors consider returns, they only think about performance when the market is up. For example, by the end of 2025 the S&P 500 had been up for a few consecutive years, and this often drives investors to want to know how they performed against that result. However, this does not mean that someone with 100% in large caps is going to do as well as a balanced portfolio over the long term.
Consider this: many of the stocks that drove performance in 2025—like Amazon, Google, and Nvidia—were actually down between -10% and -25% in the first month of 2026, while small- and mid-cap stocks were up approximately +10%. The 2022 Bear market also proved that concentrating in the recent hot performers can magnify the downside when market conditions worsen.
While owning a single hot sector can feel good in the short term, what many investors may not understand is that long-term results are driven by three factors:
Upside Capture
This measures how much of the market’s gains your portfolio captures during rallies. While it’s important, upside capture alone does not determine long-term success. A portfolio that captures all of the upside but also all of the downside is simply riding the roller coaster without any protection.
Downside Capture
This measures how much of the market’s losses your portfolio absorbs during declines. A lower downside capture means less damage during drawdowns, which means less ground to make up when markets recover. This is where balanced portfolios begin to separate themselves from concentrated ones.
Down-Market Recovery
This is arguably the most important of the three. Recovery time measures how long it takes a portfolio to get back to its previous high-water mark after a downturn. The faster a portfolio recovers, the sooner compounding is restored. A portfolio stuck in recovery mode is not making money—it’s just trying to get back to breakeven.
While upside capture is important, it’s actually not the most critical of the three factors. Down-market performance and down-market recovery matter more—and to drill down further, down-market recovery is the most important of all. Let’s look at the real-world data.
To illustrate these principles, we’ve constructed a diversified, balanced portfolio and compared its performance against a concentrated S&P 500 portfolio from December 2004 through March 2026. The results speak for themselves.
Why Do Investors Chase Returns?
Many investors are led by the promise of strong returns. While we all seek good results, what many fail to understand is how Wall Street works and how average returns often give a false signal of what’s to come.
Average returns are an accumulation of the last several years—typically 1, 3, 5, 7 and 10 years. These results are lifted or deflated by the most recent performance. Simply put, if the one-year return is strong, the average returns go up. The challenge is that average returns are not a true sign of the future—in fact, they often appear most convincing at the very end of a move—both up and down.
Let’s look at the most recent results of the S&P 500. Compare the average returns after 2025 to those after 2022. As you can see below, the average returns of the S&P 500 after 2025 are very different from those after 2022 due to that year’s results.
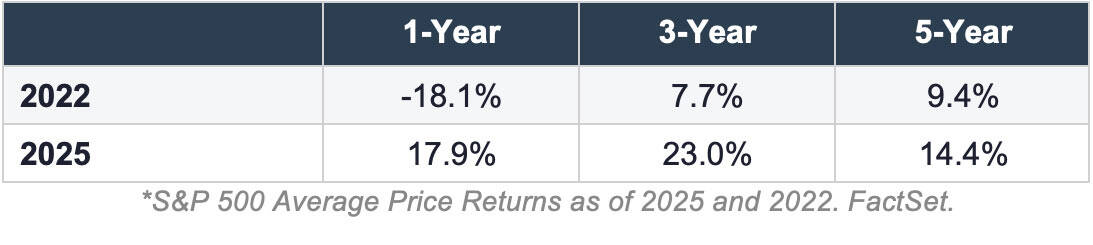
As you can see, one year can make a world of difference in average results. And more importantly, the best time to buy was when the chart looked worse.
Here’s the issue. When an index or sector moves up, the media and Wall Street begin to promote the most recent results. To make things worse, investment advisors or insurance salespeople start calling to promote the most recent returns, driving investors to chase what’s already happened. Investors who may own other sectors that lagged that year abandon their positions and move into a sector like the S&P 500—only to find that sector is now heading down while the one they abandoned is moving up.
Chasing last year’s results can often be one of the biggest reasons investors fail to secure good results over time. They chase out of fear that they are missing something—without understanding the three factors of compounding.
How Average Returns Work
As mentioned above, average returns directly correlate to the most recent results. Strong recent results lift average returns. Weak recent results lower them. Let’s look at two sectors that tell the story well: large-cap stocks versus small-cap stocks.
As you can see, in 2020 large caps performed well, bringing the 1-, 3-, and 5-year returns up. Meanwhile, small caps didn’t fare as well that year, so their 1-, 3-, and 5-year returns lagged behind large caps.
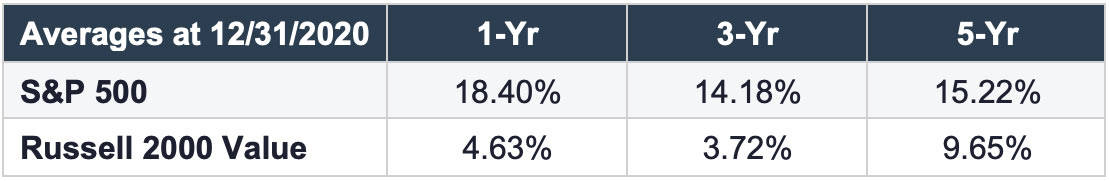
If you were in a balanced portfolio that owned small-cap stocks, your overall results would have lagged the popular sector of that year. This often makes investors believe they are missing something. When this happens and investors abandon a balanced approach, they often find that instead of adding to compounding, they are hurting it.
A word of warning: high recent results often mean that a sector may be selling at a premium, while poor recent results can often mean that a sector is selling at a discount. Why do you spread risk between sectors? Because you don’t know when sectors are going to rotate in and out of favor.
Compounding Restored: The Real-World Evidence
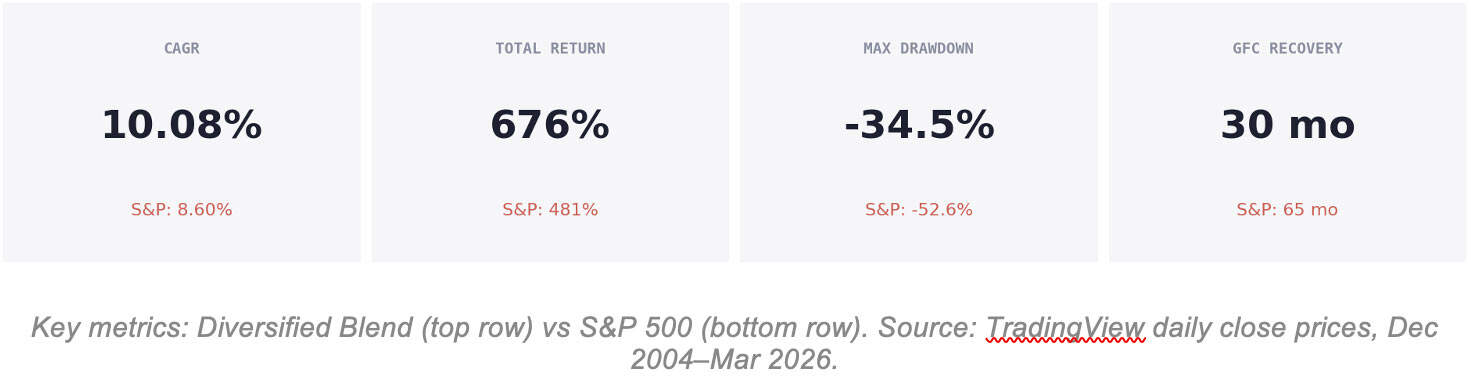
To put these principles to the test, we compared the S&P 500 against a diversified portfolio that was balanced across cap size, style (growth/value), and asset class (stocks/bonds/gold) using actual daily closing prices from December 2004 through March 2026.
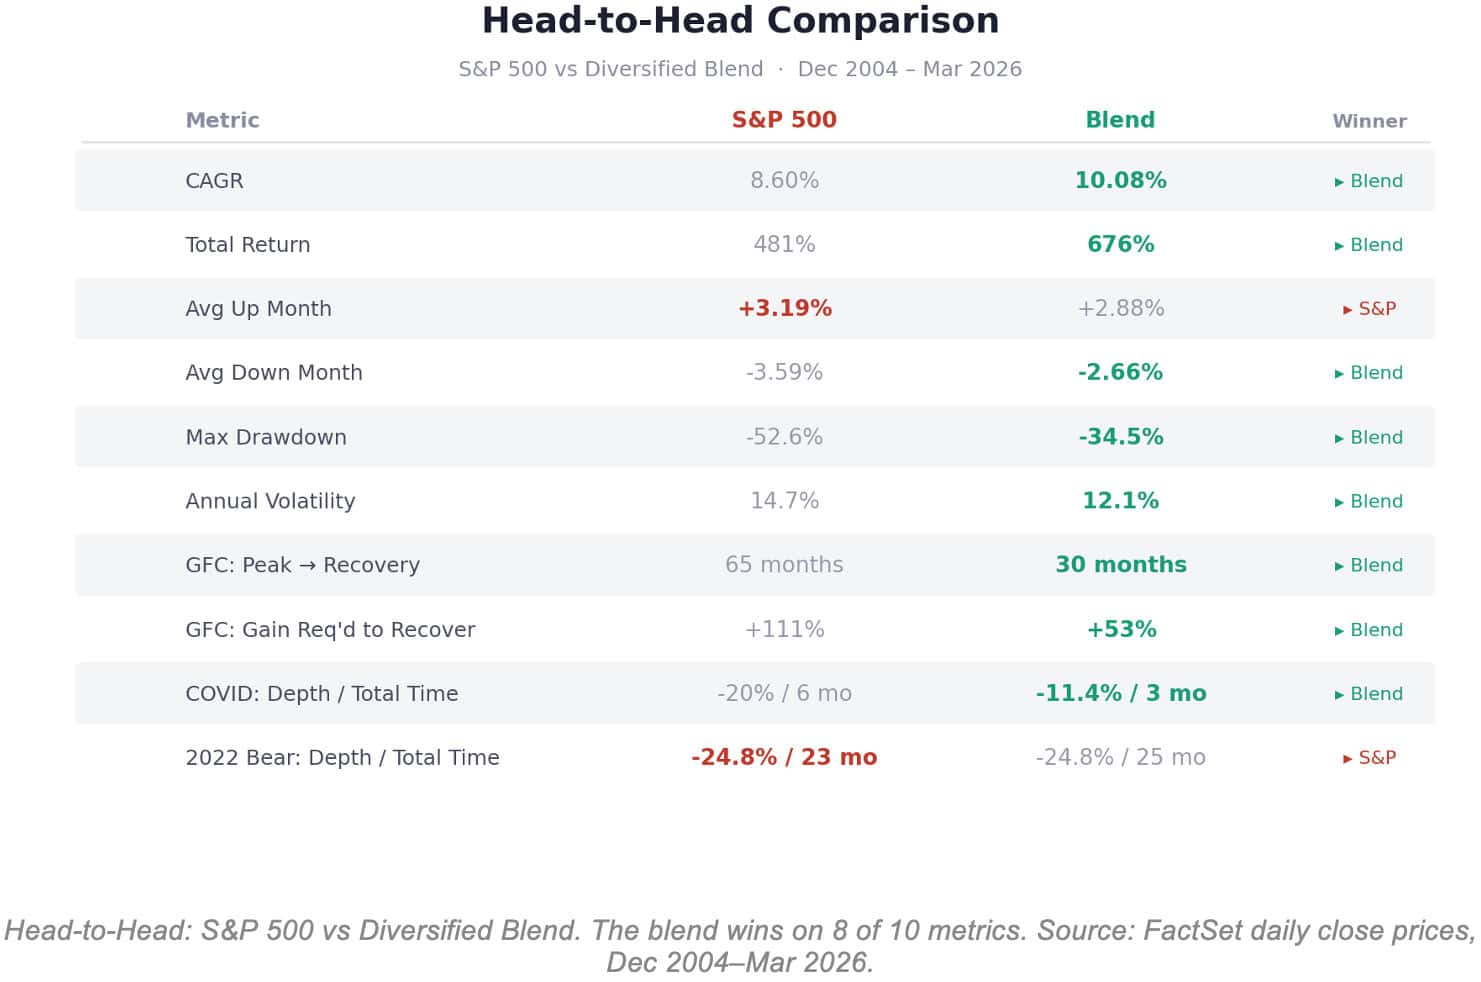
The results are striking. Over this 21-year period, the diversified blend turned every $1 million invested into $7.76 million, compared to $5.81 million for the S&P 500 alone—a total return of 676% versus 481%. The blend achieved a compound annual growth rate (CAGR) of 10.08% versus 8.60% for the S&P 500.
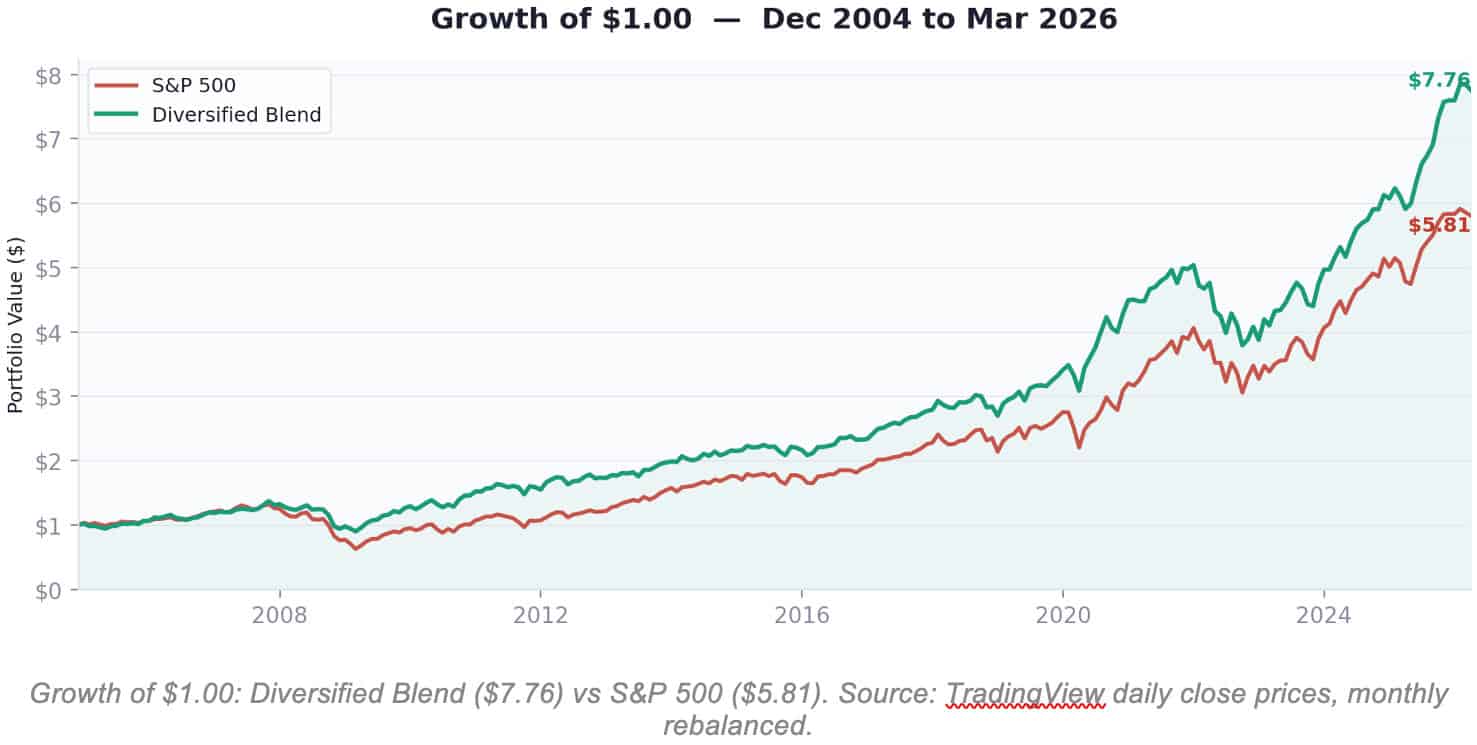
How is this possible? The blend’s average up month (+2.88%) was actually lower than the S&P 500’s (+3.19%). So the blend didn’t win by capturing more upside—it won by losing less during downturns and recovering faster. The blend’s average down month was just -2.66% compared to -3.59% for the S&P 500. That difference in downside protection compounded into a massive advantage over two decades.
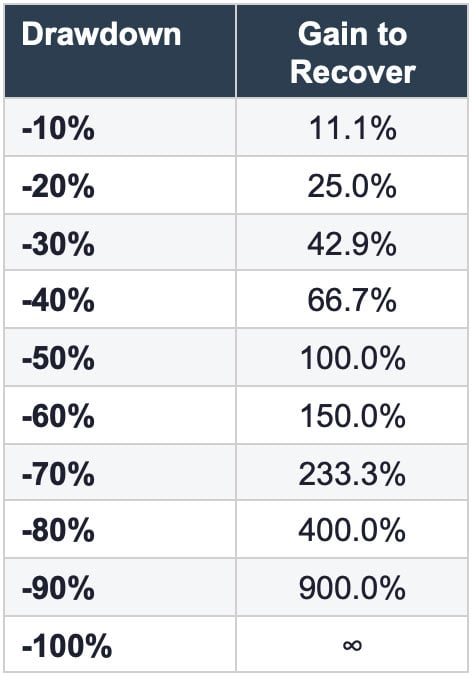
This straightforward fact about long-term compounding means that if you can recover more quickly, you begin to make money again sooner. The table below shows the required gain to break even after a drawdown. In the case of the S&P 500 during the Global Financial Crisis, a -52.6% drawdown required a gain of over +111% just to get back to even. Compare that to the diversified blend, which experienced a -34.5% drawdown and only needed a +53% gain to recover.
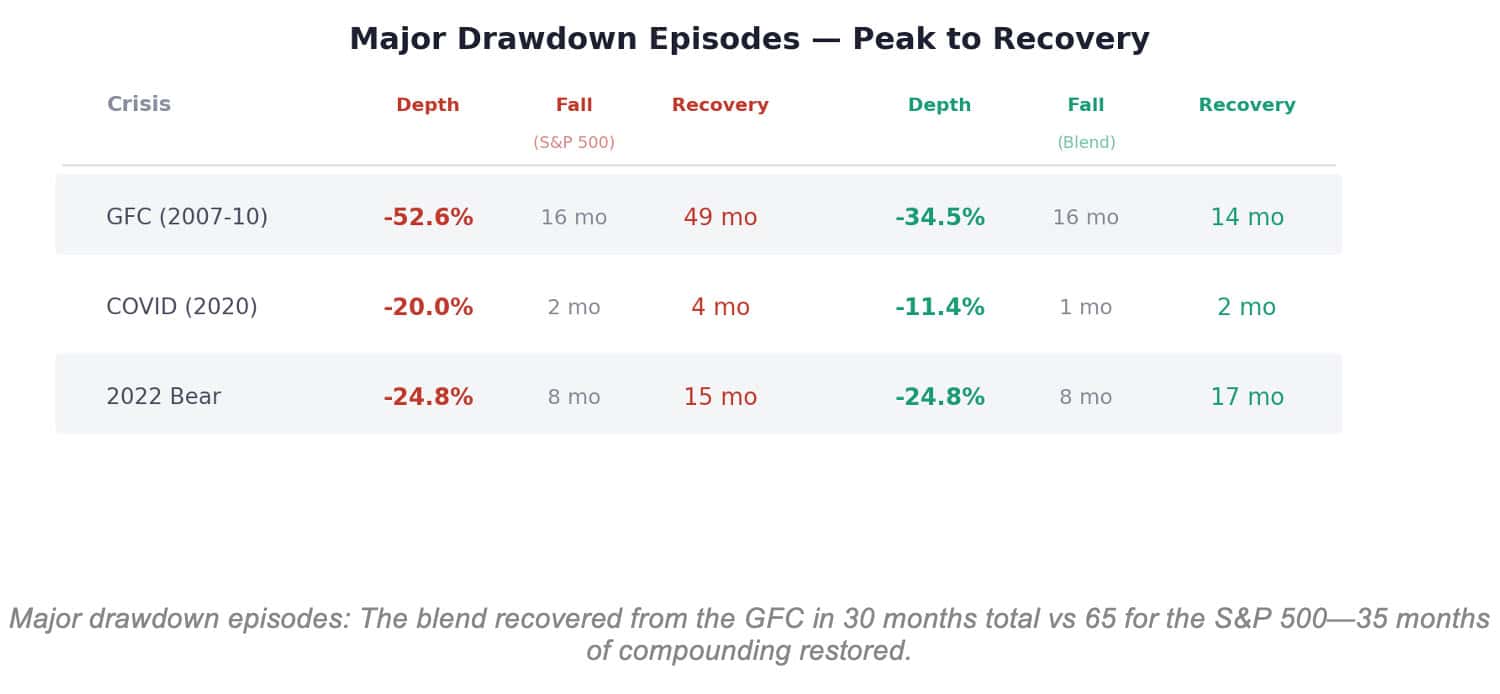
The chart below tells the full story. Notice how the S&P 500 (red) plunges to -52.6% during the GFC, while the diversified blend (green) bottoms at -34.5%. More importantly, look at the recovery: the blend climbed back to its high-water mark in just 14 months, while the S&P 500 took 49 months—more than four years. That’s 35 months of additional compounding time that the blend had and the S&P 500 didn’t.
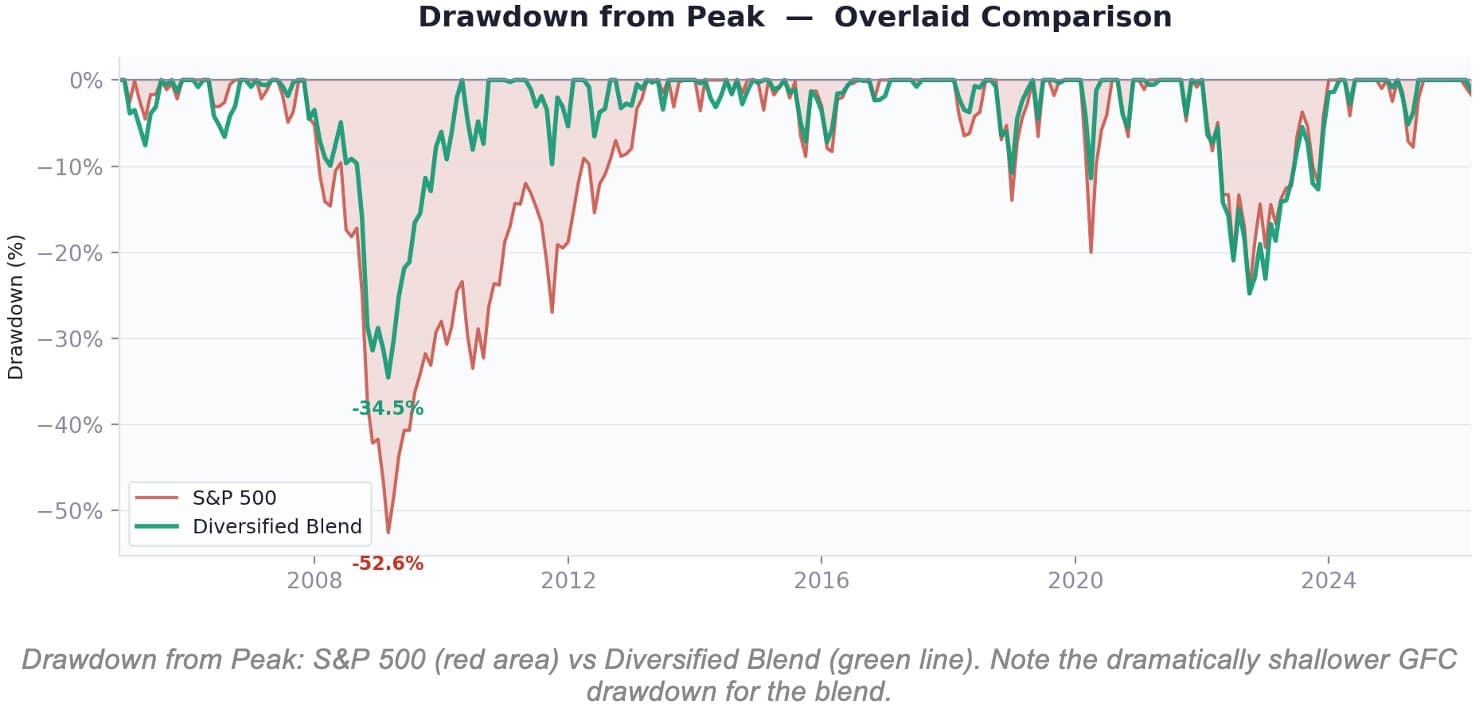
Even though the S&P 500 has had headline-grabbing returns in recent years, it never caught up to the diversified blend’s steady results. The reason is clear: down-market performance and down-market recovery are more important than short-term upside capture.
It’s Not Always What You Make—It’s What You Keep
The history of the markets is often made up of old stories and recurring bad habits. There is truly nothing new under the sun. Sectors go up, average returns go up, Wall Street hype takes hold, people chase results, the sector goes down, and investors run in fear. This cycle is hundreds of years old.
The Dot-Com Bust. The Nifty Fifty. The Crypto Frenzy. These are just a few examples of the same pattern repeating itself. What we have found over nearly four decades of managing money is that the investor who buys quality, spreads risk, and takes a balanced approach will always fare better over time—while chasing seldom pays off.
What’s more important is time in the market, not timing the market.
Sector Rotation: Why Balanced Portfolios Win
One of the most underappreciated realities in investing is how quickly sector leadership rotates. A sector that leads one year may lag the next, and vice versa. This rotation is precisely why no investor should concentrate their portfolio in a single sector or asset class based on recent results.
By spreading risk across multiple sectors—large cap, small cap, mid cap, international, bonds, real estate, and commodities—investors position themselves to participate in whichever area of the market is leading at any given time. You don’t have to guess which sector will outperform next year because you already own exposure to all of them.
The temptation, of course, is to look at last year’s winner and assume it will keep winning. But history tells us the opposite is more likely. Sectors that have recently outperformed often cool off, while the sectors that lagged frequently take the lead. A balanced, diversified portfolio ensures that you’re positioned for both outcomes without having to make a prediction.
What Does a Balanced Portfolio Look Like?
A truly balanced portfolio is not simply 60% stocks and 40% bonds—though that is a starting point many investors are familiar with. A well-constructed balanced portfolio spreads risk across multiple asset classes and sectors to capture the benefits of diversification while minimizing the impact of any single sector’s downturn.
At Linden Thomas & Co., we believe a balanced portfolio should include exposure to at least seven distinct sectors or asset classes: large-cap stocks, mid-cap stocks, small-cap stocks, international equities, bonds, real estate, and commodities or precious metals. Each of these sectors plays a specific role within the portfolio.
Large-cap stocks provide stability and growth. Small- and mid-cap stocks offer higher return potential and diversification benefits. International equities reduce domestic concentration risk. Bonds provide income, reduce volatility, and act as a cushion during stock market drawdowns. Real estate and commodities offer inflation protection and tend to behave differently than traditional stocks and bonds.
When these sectors are combined thoughtfully, the result is a portfolio that may not lead the charts in any given year—but one that compounds wealth more efficiently over time because it recovers faster, experiences shallower drawdowns, and spends more of its life growing rather than digging out of a hole.
The head-to-head comparison below puts it all together. Across 10 key performance metrics spanning over two decades of real market data, the diversified blend wins on 8 of 10 measures:
How Linden Thomas & Co. Builds Quality Indexes
At Linden Thomas & Co., we broke tradition to build a more efficient index that moves away from the shortfalls of market-cap-weighted indexes, with a focus on enhancing long-term compounding. This undertaking meant we needed to address all three dynamics of compounding: maximizing upside capture, minimizing downside capture, and shortening down-market recoveries.
While we believe no investor can consistently time market rallies and drawdowns, what we have found over more than 35 years of managing high-net-worth investors is that the quality of the portfolio matters. Direct ownership matters. And minimizing costs matters.
Because earnings quality, direct ownership, and cost truly impact investor compounding, our team set out to build an institutional index focused on company earnings quality, giving investors direct ownership, and minimizing the hidden costs of retail investment products.
Because results have a direct correlation to portfolio efficiency, we built indexes that consider all three compounding factors—upside, downside, and down-market recovery. This empowers investors who seek strong long-term results with less downside risk and quicker recovery.
Some investors may try to enhance compounding simply by adjusting their portfolio allocation. But this only solves a small part of what’s needed—much like getting an oil change when you need a whole new engine. Enhancing long-term compounding means opening the hood and removing or fixing the parts that impact all three factors, so that upside is maximized, downside is minimized, and down-market recovery is shortened.
Conclusion
The allure of headline-grabbing returns is powerful. When a concentrated portfolio or single sector posts an impressive year, it’s only natural to wonder whether you’re missing out. But as we’ve outlined in this review, short-term performance tells only a fraction of the story.
True long-term wealth is not built by chasing what’s already happened—it’s built by staying the course with a quality, balanced portfolio that manages all three factors of compounding. A balanced approach may not make headlines, but it spends more time growing and less time recovering. And over a full market cycle, that’s the difference between building wealth and simply riding the roller coaster.
Stay balanced. Stay disciplined. That’s how you compound wealth over time.
Disclaimer
Investing is subject to a high degree of investment risk, including the possible loss of the entire amount of an investment. An investor should carefully read and review all information provided by Linden Thomas Advisory Services, LLC (“Linden Thomas”), including the Form ADV, Part 2A brochure and all supplements thereto, before making an investment.
Balanced portfolio consists of 55% NASDAQ / 5% S&P 500 / 5% RUSSELL 2000 / 15% iShares Core US Aggregate Bond ETF / 20% SPDR Gold Trust ETF. Data from TradingView. Returns are price returns and not inclusive of any dividend reinvestment.
The information contained herein reflects the opinions and projections of Linden Thomas as of the date of publication, which are subject to change without notice at any time subsequent to the date of issue. Linden Thomas does not represent that any opinion or projection will be realized. All information provided is for informational purposes only and should not be deemed as investment advice or a recommendation to purchase or sell any specific security.
While the information presented herein is believed to be reliable, no representation or warranty is made concerning the accuracy of any data presented. Prospective clients should not treat these materials as advice in relation to legal, taxation, or investment matters.
Statements herein that reflect projections or expectations of future financial or economic performance of investments, including investments in the Linden Thomas US Equity Earnings Focused Indexes (the “Indexes”), are forward-looking statements. Such forward-looking statements are based on various assumptions, which assumptions may not prove to be correct. Accordingly, there can be no assurance that such assumptions and statements will accurately predict future events or the Fund’s actual performance. No representation or warranty can be given that the estimates, opinions, or assumptions made herein will prove to be accurate.
Any projections and forward-looking statements included herein should be considered speculative and are qualified in their entirety by the information and risks disclosed in the confidential offering document. Actual results for any period may or may not approximate such forward-looking statements. Prospective investors are advised to consult with their own independent tax and business advisors concerning the validity and reasonableness of the factual, accounting, and tax assumptions.
No representations or warranties whatsoever are made by Linden Thomas or any other person or entity as to the future profitability of the Index or the results of making an investment based on the Index. Past performance is not a guarantee of future results.
The Index performance results presented do not represent the results of an actual client investment but were achieved by means of the retroactive application of the rules of the Index to a portfolio. This portfolio is hypothetical only and may include estimates, projections, and forward-looking and back-tested results. The trades during the back test were not actually executed, and the back-tested results are not necessarily indicative of the performance of the Index. No representation is being made that any account will or is likely to achieve profits or losses similar to those shown.
Hypothetical back-tested performance results have many inherent limitations. One of these limitations is that such results are generally prepared with the benefit of hindsight. In addition, hypothetical trading does not involve financial risk, and no hypothetical trading record can completely account for the impact of financial risk in actual trading. The ability to withstand losses or to adhere to a particular trading program despite trading losses are material points that can adversely affect actual trading results.
There are numerous other factors related to the markets in general or to the implementation of any specific trading program that cannot be fully accounted for in the preparation of hypothetical performance results, all of which can adversely affect actual trading results, including, but not limited to, changes in the investment landscape and unexpected changes in market or economic conditions.
Various indices, including but not limited to the S&P 500 Index and the Russell 2000 Index (each a “Third-party Index”), are unmanaged indices of securities used as general measures of market performance. Their performance is not reflective of the performance of any specific investment. Third-party Index comparisons are provided for informational purposes only and should not be used as the basis for making an investment decision. Investments cannot be made directly into the Index or any Third-party Index.
There may be significant differences between the Index and each Third-party Index, including but not limited to risk profile, liquidity, volatility, and asset composition. Performance shown for Third-party Indices reflects no deduction for fees or expenses. Accordingly, such comparisons may be of limited use.
By accepting this information, the recipient agrees not to divulge any information contained herein to any other party. This presentation and its contents are confidential and proprietary information of Linden Thomas. Any reproduction, in whole or in part, without prior written consent of Linden Thomas is prohibited.
Investment advisory services are offered through Linden Thomas Advisory Services, LLC, an SEC-registered investment adviser. Linden Thomas Advisory Services, LLC is owned by Linden Thomas Financial Group, LLC, doing business as “Linden Thomas and Company.” Data, opinions, and other material provided herein are for informational purposes only and should not be considered indicative of future results. Data has been obtained from sources considered reliable; however, no guarantee is made regarding accuracy or completeness.
Nothing contained herein should be considered investment, financial, legal, tax, or other advice, nor should it be relied upon in making investment or other decisions. For further information on the criteria or methodology of any awards referenced, or the relevant articles and publications in which they appear, please contact your Representative. Linden Thomas does not directly or indirectly compensate third-party rating agencies to be considered for awards.
Related Articles

How Do Recent Returns Impact Average Returns?
Investment Principles,
Top Investment Principles FAQs,
Understanding Results,
November 19, 2024
3 Factors of Compounding: Upside, Downside, and Recovery
Investment Principles,
March 28, 2025
What are the 10 most common investor mistakes?
Investment Principles,
Personal Finance,
Top Investor Mistakes,
Top Personal Finance FAQs,
November 19, 2024