

Portfolio Inefficiencies: How Hidden Costs Detract from Your Performance
At Linden Thomas & Co., we often liken a portfolio to an onion – there are countless layers of inefficiencies that many investors, particularly those in pooled funds, don’t see until they start peeling back the skin. These inefficiencies may be small individually, but they compound over time, quietly eroding returns. For affluent investors it’s essential to understand and minimize these hidden costs to maximize portfolio performance.
1. Expense Ratios: The Cost of Management
Every mutual fund or ETF has an expense ratio, which covers the cost of managing the fund. While a fraction of a percent may seem insignificant, over time, these fees can eat into your returns. For example, a 1% expense ratio on a $2 million portfolio could cost $20,000 annually.
The exhibit below (Exhibit 1) illustrates the potential magnitude of a 1% expense ratio on a hypothetical $2 million portfolio with an 8% annual rate of return over 10 years:
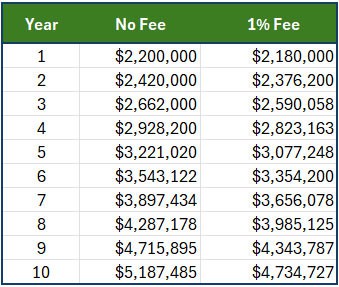
Exhibit 1 (source: Linden Thomas & Co)
2. Advisor Fees: Paying for Advice or Performance?
Many investors pay an advisor 1% or more to manage their portfolio. The question is, are you getting your money’s worth? The advisor is quite often outsourcing the money management responsibilities to a third-party such as a mutual fund company or ETF.
3. Trading Costs: The Price of Activity
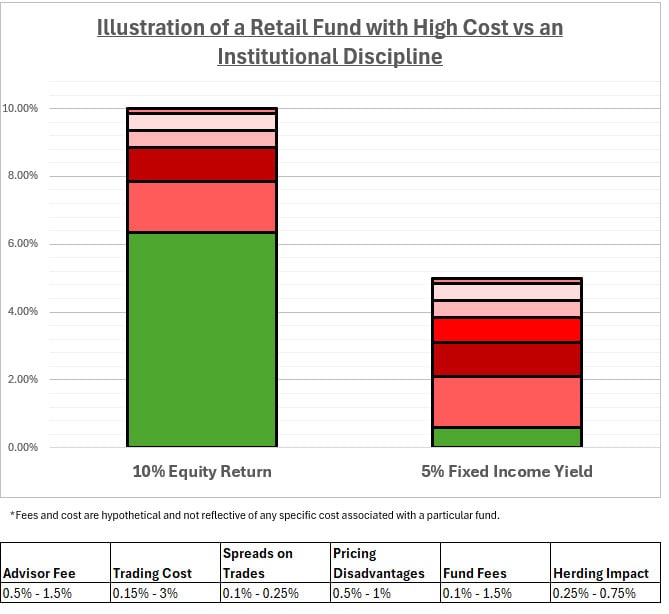
Frequent trading generates transaction costs, including commissions, bid-ask spreads, and taxes. While modern platforms may offer “free” trading, these costs still exist in less direct forms. More importantly, funds that engage in high turnover often push these costs onto their investors.
For instance, if a fund turns over 100% of its holdings in a year, then every security in the fund has been bought and sold within 12 months. Such activity increases trading costs and ultimately lowers your total return. A pair of studies conducted by the University of California and the University of Virginia found that the average trading cost can be 1.44%, with large cap costs at 0.84% and small cap costs as high as 3.17% (source: Edelen, Roger, Evans, Richard, and Kadlec, Gregory, “Shedding Light on ‘Invisible’ Costs: Trading Costs and Mutual Fund Performance,” Financial Analysts Journal (January/February, 2013), pp. 33-44.).
4. Disadvantages of Pooled Bond Funds: Misaligned Incentives
Bond funds, particularly those in the retail market, often face pricing inefficiencies, especially during volatile periods. Managers may be forced to sell bonds at a loss to meet redemptions, and investors may end up holding a portfolio of bonds that are priced at a premium but no longer offer attractive yields.
This is why we advocate for direct ownership of bonds, where you have more control and transparency regarding yield and maturity. In addition, when interest rates fall, bonds appreciate in price, but their yield-to-maturity drops. Investors who buy into a bond fund after this appreciation are left holding a portfolio of bonds with minimal yield upside, while also being exposed to the risk of price depreciation if rates rise.
By contrast, when you own bonds directly, you can hold them to maturity and avoid the reinvestment risk that bond funds impose.
5. Small Investor Herding: Unseen Costs in a Crowd
When small investors panic during a market downturn, they often exacerbate selling frenzies. This behavior can force fund managers to sell assets at the worst possible time – when prices are depressed – just to meet liquidity needs. The impact? Increased trading costs for the fund, which reduces performance for all investors.
A textbook example of this occurred during the COVID-19 market panic in 2020. Retail investors poured out of bond funds, forcing fund managers to sell bonds at steep discounts to maintain liquidity. Those who remained in the fund shouldered the cost of these ill-timed sales.
6. Phantom Taxes: Hidden Erosion of Wealth
Funds distribute capital gains to shareholders, and these are taxed, even if you haven’t sold any of your fund shares. This is particularly frustrating because you’re paying taxes on profits that may have been reinvested, reducing your net after-tax return. In other words, you may end up owing taxes even if your investments are down!
Direct ownership of securities helps avoid these phantom taxes, as you’re in control of when to realize gains or losses.
7. The Benefits of Direct Ownership of Securities
Owning individual securities directly – rather than as part of a pooled fund – offers several advantages. You control the timing of trades, can minimize taxes by strategically selling losers, and avoid the herd mentality that often plagues mutual fund investors. You also have full transparency into your holdings, which is often lacking with pooled funds.
8. Limited Transparency in Pooled Funds
Mutual funds and ETFs often lack full transparency, particularly when it comes to daily holdings and sector allocations. Investors might not realize that their fund has overconcentration in specific sectors, like Technology, until it’s too late. This can lead to an imbalance in your broader portfolio that exposes you to greater risk.
9. Cash Drag: Idle Capital Hurts Returns
Funds must keep cash on hand for redemptions, which can create a drag on performance. When markets are rising, having too much cash means you’re missing out on opportunities to generate returns. For example, a fund holding 5% in cash in a bull market could underperform the broader market by several percentage points, simply due to idle capital.
10. Overconcentration in One or More Sectors
Sector concentration–particularly in popular sectors like technology–can create significant risk. When one sector becomes overweight, as tech did during the late 1990s and again in the 2020s, a downturn in that sector can drag down the entire portfolio. This often happens without investors realizing the degree of concentration, especially in pooled funds.
11. Portfolio Overlap: A Hidden Risk
Investors often hold multiple funds, thinking they’re well-diversified. However, many large funds own the same stocks, leading to unintentional overlap and overexposure to certain companies or sectors. This creates an unintended concentration risk, which can magnify losses during a downturn.
12. Excessive Portfolio Turnover: Tax Implications
High turnover in a mutual fund generates short-term capital gains, which are taxed at a higher rate than long-term gains. Over time, this excessive turnover can result in a larger tax bill for investors, detracting from after-tax returns. The table below illustrates the impact of turnover on a hypothetical $2 million portfolio over a 5-year period, with an annual 8% rate of return (Exhibit 2). The difference in portfolio ending values exemplifies the harmful impact that turnover can wreak on an investor – over $200,000!
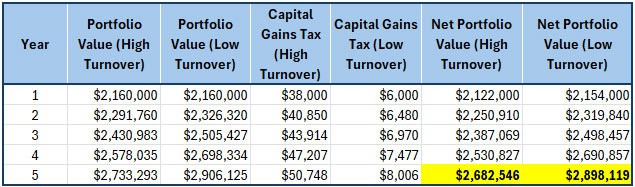
Exhibit 2 (source: Linden Thomas & Co)
13. Style Drift: Mutual Fund Bloating
As mutual funds grow larger, they can drift from their original strategy. This phenomenon, known as style drift, occurs because managing a larger pool of capital requires investing in more stocks or bonds than the fund’s original mandate allowed. As a result, the fund becomes less focused and negatively impact results.
14. Mismanagement of Downside Capture
If a portfolio is too aggressively positioned, it can lead to significant losses during a market downturn. This mismanagement of downside risk is particularly dangerous for investors relying on their portfolio for distributions. Overexposure to risky assets can force the sale of securities at depressed prices, reducing the portfolio’s ability to recover.
15. The hidden cost of investing in low-quality companies
Another inefficiency that often slips under the radar is the reliance on pooled investment funds – especially market-cap-weighted index funds – that select stocks based primarily on market capitalization rather than financial fundamentals like balance sheet strength and earnings quality. In these funds, companies with the largest market caps receive the highest allocations, regardless of whether they are financially sound or struggling to generate sustainable earnings. This approach can result in overexposure to high-profile stocks that may not align with an investor’s quality-focused strategy. By contrast, directly investing in companies with solid balance sheets and durable earnings offers a more thoughtful approach, one that seeks to reduce exposure to inefficiencies inherent in broad market-cap-weighted funds.
Conclusion: Peeling Back the Layers
At Linden Thomas & Co., we believe that avoiding these inefficiencies is crucial to long-term investment success. Each layer of inefficiency may seem small, but together, they can detract significantly from portfolio performance. Direct ownership of securities, careful management of fees, and avoiding the pitfalls of pooled funds are all essential steps toward building a more efficient, high-performing portfolio.
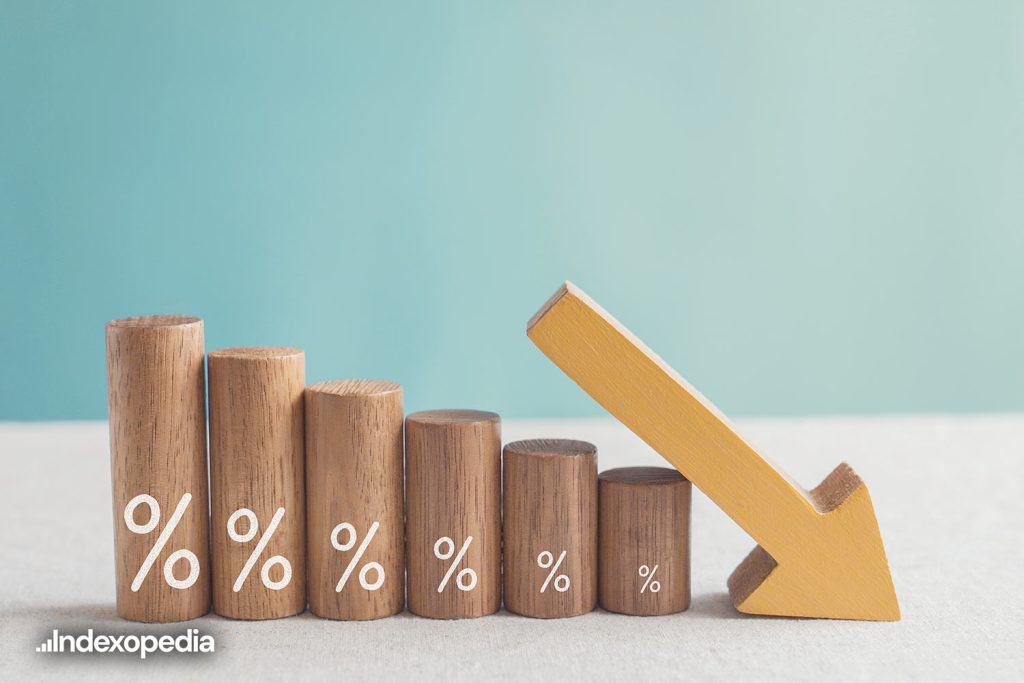
The chart below (Exhibit 3) represents the impact of portfolio drag on a hypothetical $2 million starting portfolio. As you can see, over time, even a small amount of drag can have significant consequences when it comes to investment results over time:
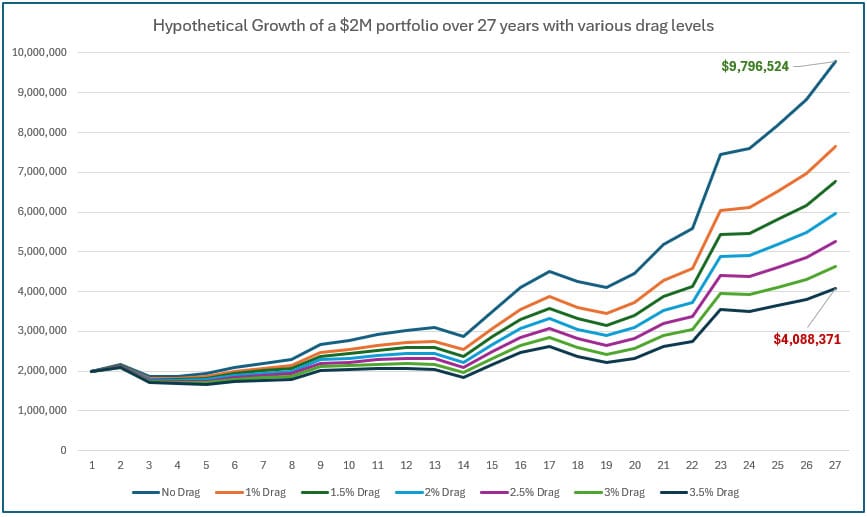
Exhibit 3 (source: Linden Thomas & Co)
In the end, an investor’s portfolio is much like an onion – layered with complexity. Each layer, from fees to trading costs, from taxes to an overemphasis on certain factors like quality, must be carefully peeled back and examined. Failing to address these inefficiencies can leave investors with a portfolio that doesn’t serve them as well as it should. But just as peeling an onion reveals its core, a thoughtful, strategic approach reveals a portfolio that’s truly aligned with long-term financial goals. By addressing each inefficiency, investors can reveal a portfolio that’s solid, sustainable, and capable of delivering the desired objectives.
Related Articles

What are Mutual Fund Inefficiencies?
Index Investing,
Indexing for the Affluent,
Investment Principles,
Top Investment Principles FAQs,
November 19, 2024
4 Critical Impacts of an Inefficient Portfolio
Investment Principles,
Portfolio Considerations,
January 8, 2025

Are advisor fees and costs important to investment results?
Investment Principles,
Top Investment Principles FAQs,
January 8, 2025